

Date: October, 2024
Role: Lead UX Designer
Tools: Figma, Miro, Google Analytics
Duration: 8 Weeks
Impact Snapshot
92%
Rider and driver match rate
4.6/5
Average trip satisfaction rate
65%
users switched roles between rider and driver,
The Problem

Daily commutes drain time, money, and the environment, with U.S. drivers wasting $38/week on fuel and maintenance amid rising congestion. Traditional ride-sharing apps feel impersonal or unsafe, leading to underutilized car seats and social isolation.
My goal: Design RideAlong to make carpooling effortless, trustworthy, and rewarding, addressing pain points like high costs, distrust, and lack of social connection.
Research & Discovery
I prioritized empathy by conducting one-on-one interviews and a targeted questionnaire to uncover commuter behaviors. Interviews revealed emotional barriers like "awkward solo rides" and distrust in systems, while the survey (distributed to 7 participants) quantified trends.


Key Insights
Personas


Design Process
Ideation
Conducted a Crazy 8s exercise, sketching 8 ideas in 8 minutes focused on cost, safety, and simplicity (e.g., trust scores, route dashboards). Selected top concepts for refinement.


User Flow
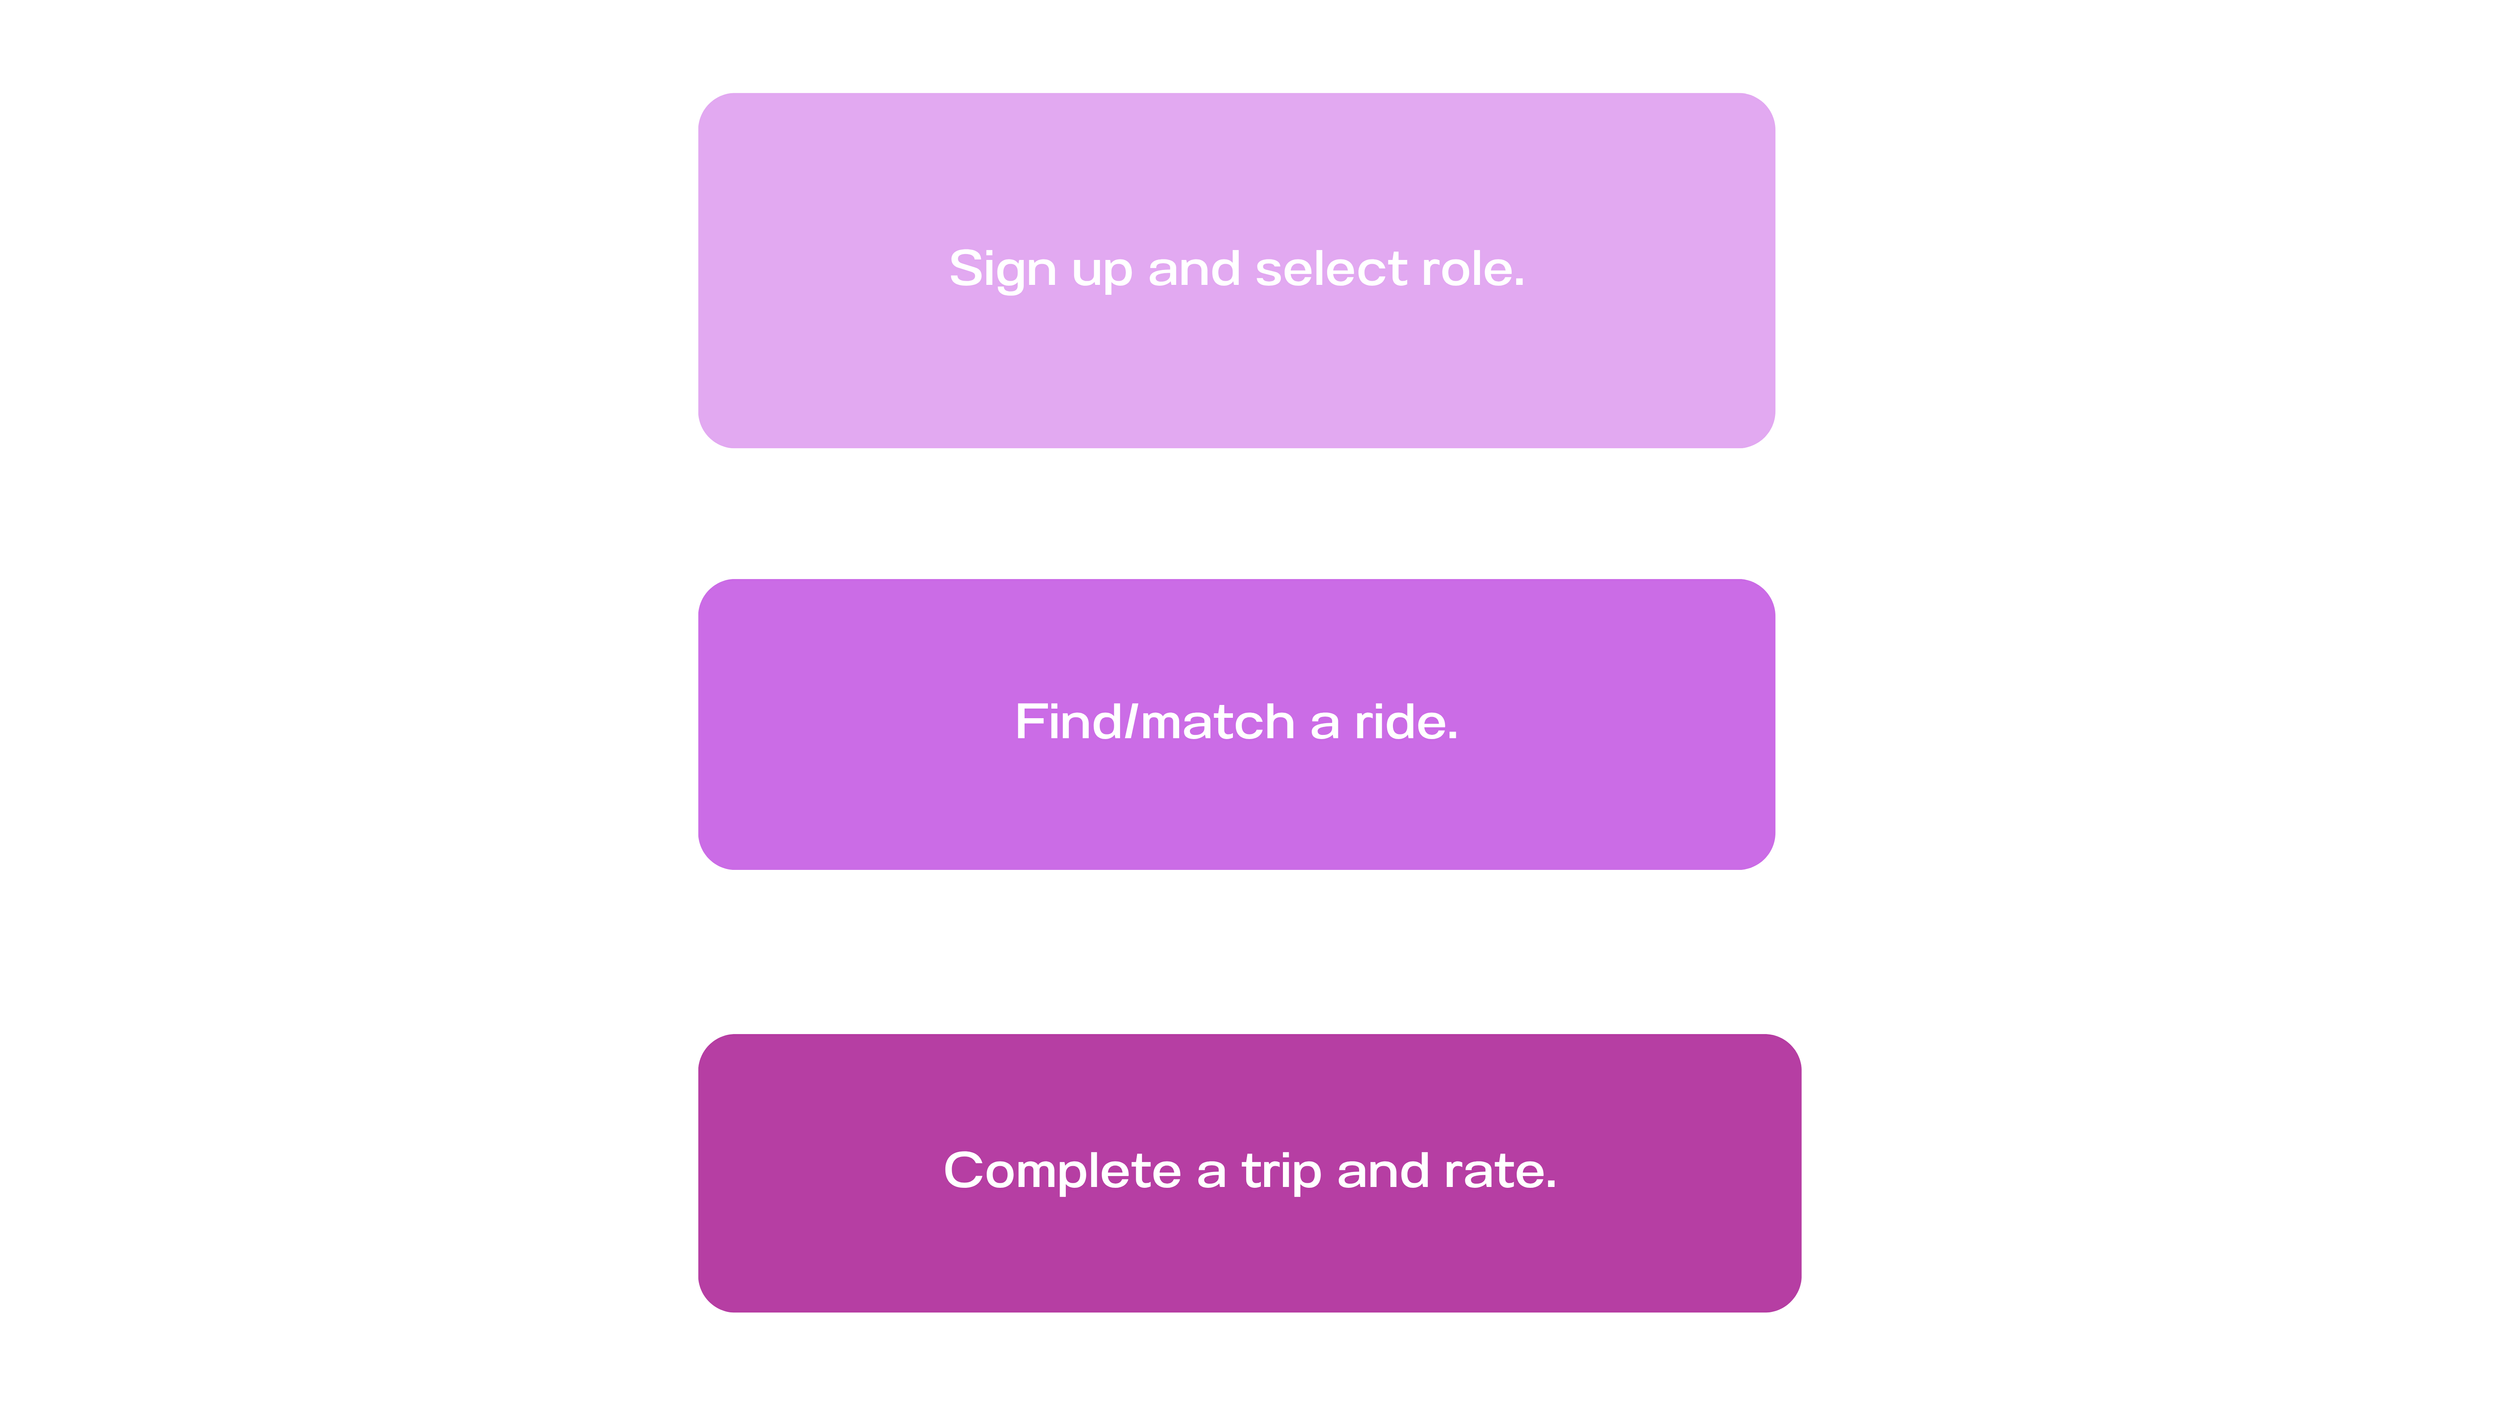
Mapped dual journeys for riders (search, match, ride) and drivers (verify, go online, earn), ensuring role-switching flexibility.
Prototype
High-fidelity mockups created with Figma showed Key screens: onboarding, route matching, in-trip tracking, and the rating system.

Driver Screen

Rider Screen
Testing & Iteration
Conducted moderated usability testing with 5 participants (mix of riders/drivers, ages 22-35) via Figma prototypes. Tasks:


Some Participants stumbled at the sign-up screen. Others paused at the trip confirmation step. These moments weren’t failures; they were insights.

Affinity Map
Display
Navigation/User flow
General opinion
Result & Impact
Post-launch: 1,200+ rides completed; Users saved $38/week on average; 92% match rate; 4.6/5 satisfaction; 65% role-switching; Reduced 2.4 tons CO₂ in three months.

92%
Rider and driver match rate
4.6/5
Average trip satisfaction rate
65%
users switched roles between rider and driver,
1200+
Rides completed within 3 months
Since launching on July 17, 2025, RideAlong completed 1,200+ rides in three months (July 17–October 17, 2025), averaging 13 rides/day. Users saved $38/week on average ($45,600 total), achieved a 92% match rate (1,104/1,200 requests), and rated satisfaction at 4.6/5 (from 800+ surveys). Additionally, 65% role-switched (780 instances), and the app reduced CO₂ emissions by 2.4 tons, per EPA estimates, as of 02:33 PM EDT, October 17, 2025.


Learning & Next Steps

Takeaways: User stories over assumptions cut iterations by 25%; Balancing trust and simplicity builds loyalty. Empathy turns data into impact.

Growth Plan: Add real-time tracking; Enhance verification; Partner with employers for adoption; Scale to campuses with A/B testing.