
Date: Jun 2025
Role: UX Designer/ Researcher
Tools: Figma, Miro, Google Forms, Zoom
Duration: 6 Months
Impact Snapshot
30%
Decrease in task completion time
25%
Boost in data interpretation and accuracy
40%
Increasing in Pulp manufacturing ROI
The Problem

Factory workers previously managed refills, inspections, and maintenance via paper logs, requiring trips to a central control panel for data entry. This led to delays, errors, and suboptimal productivity, limiting focus on critical issues.
Time-intensive manual workflows: Factory workers used paper for tasks like refills and inspections. They had to walk to a central panel for data entry. This slowed operations. It reduced efficiency.

Fragmented data access and entry: Workers handled info across paper logs and digital inputs. The system was disjointed. It caused delays and inconsistencies. Errors rose in tracking mill activities.

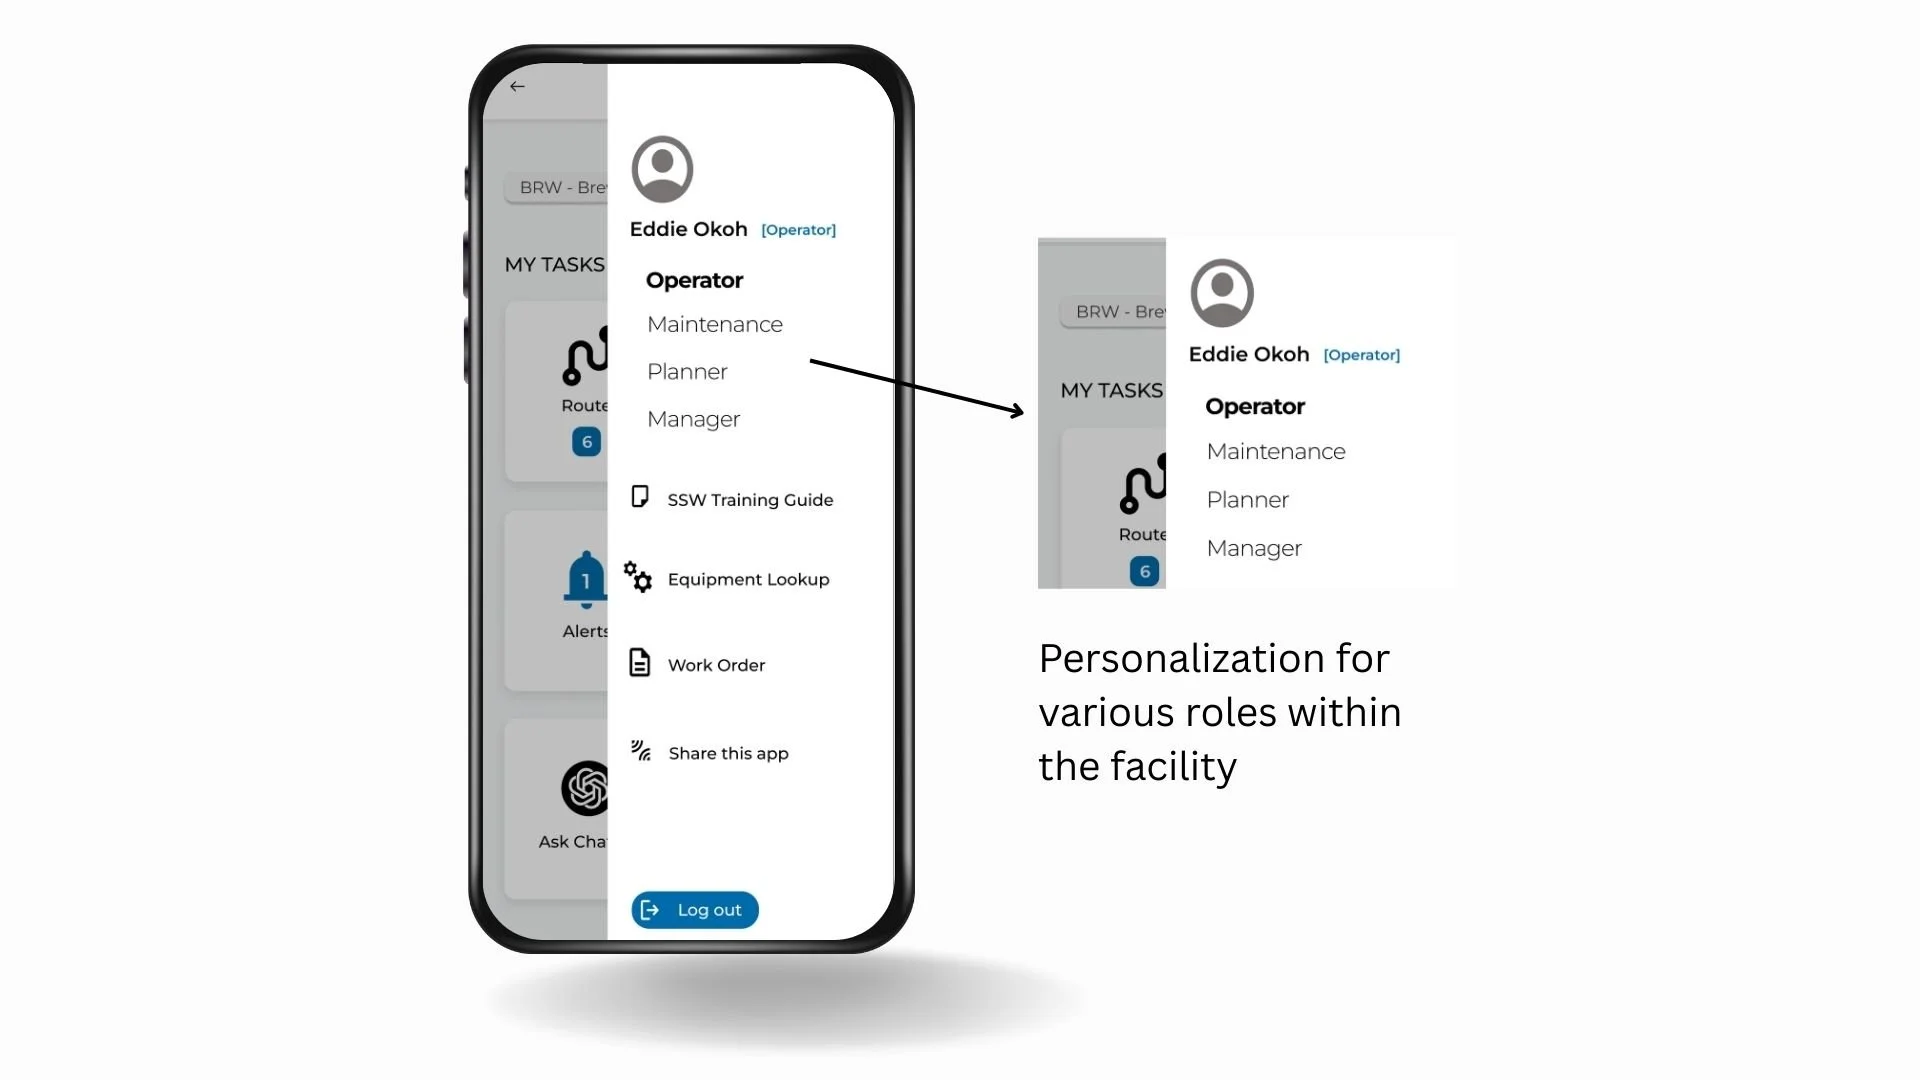
No personalization for varying technical skills: The approach was one-size-fits-all. It ignored tech proficiency differences. Interfaces were too simple or complex. This slowed adoption and performance.
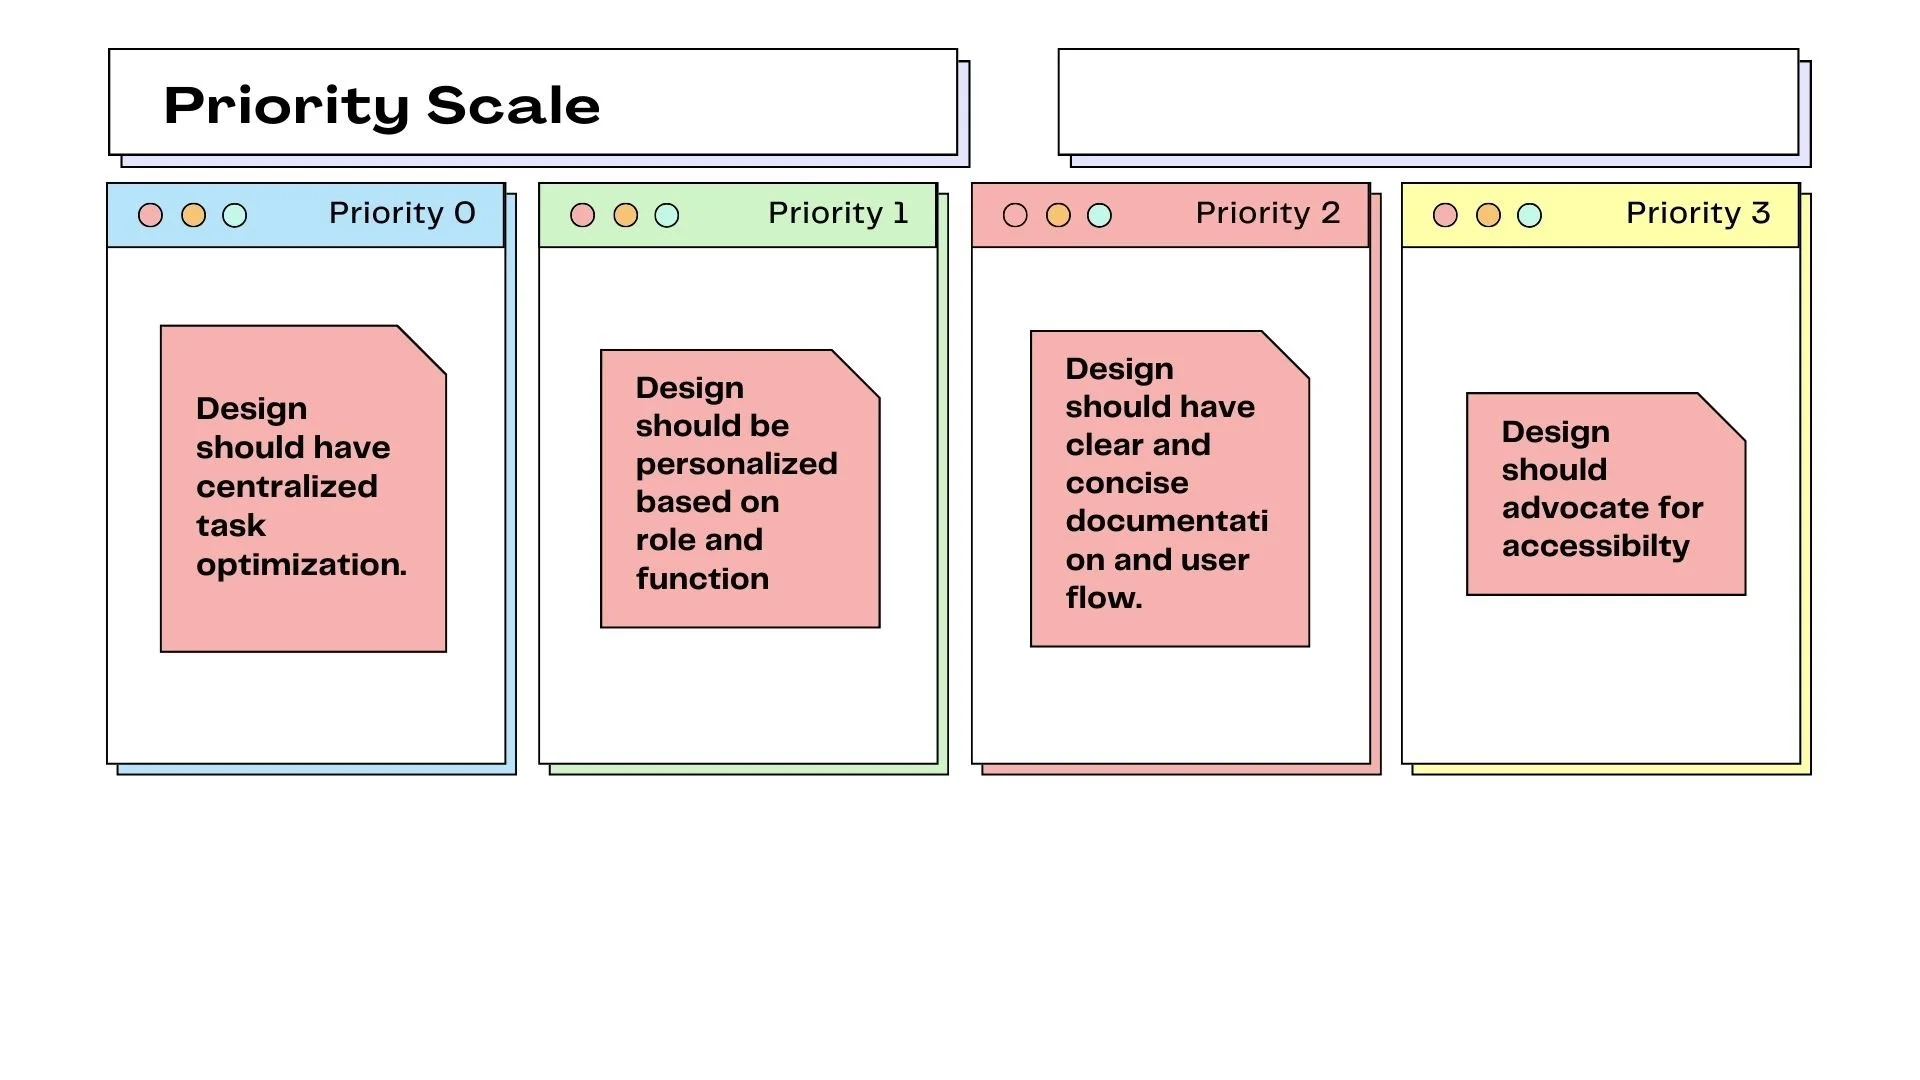
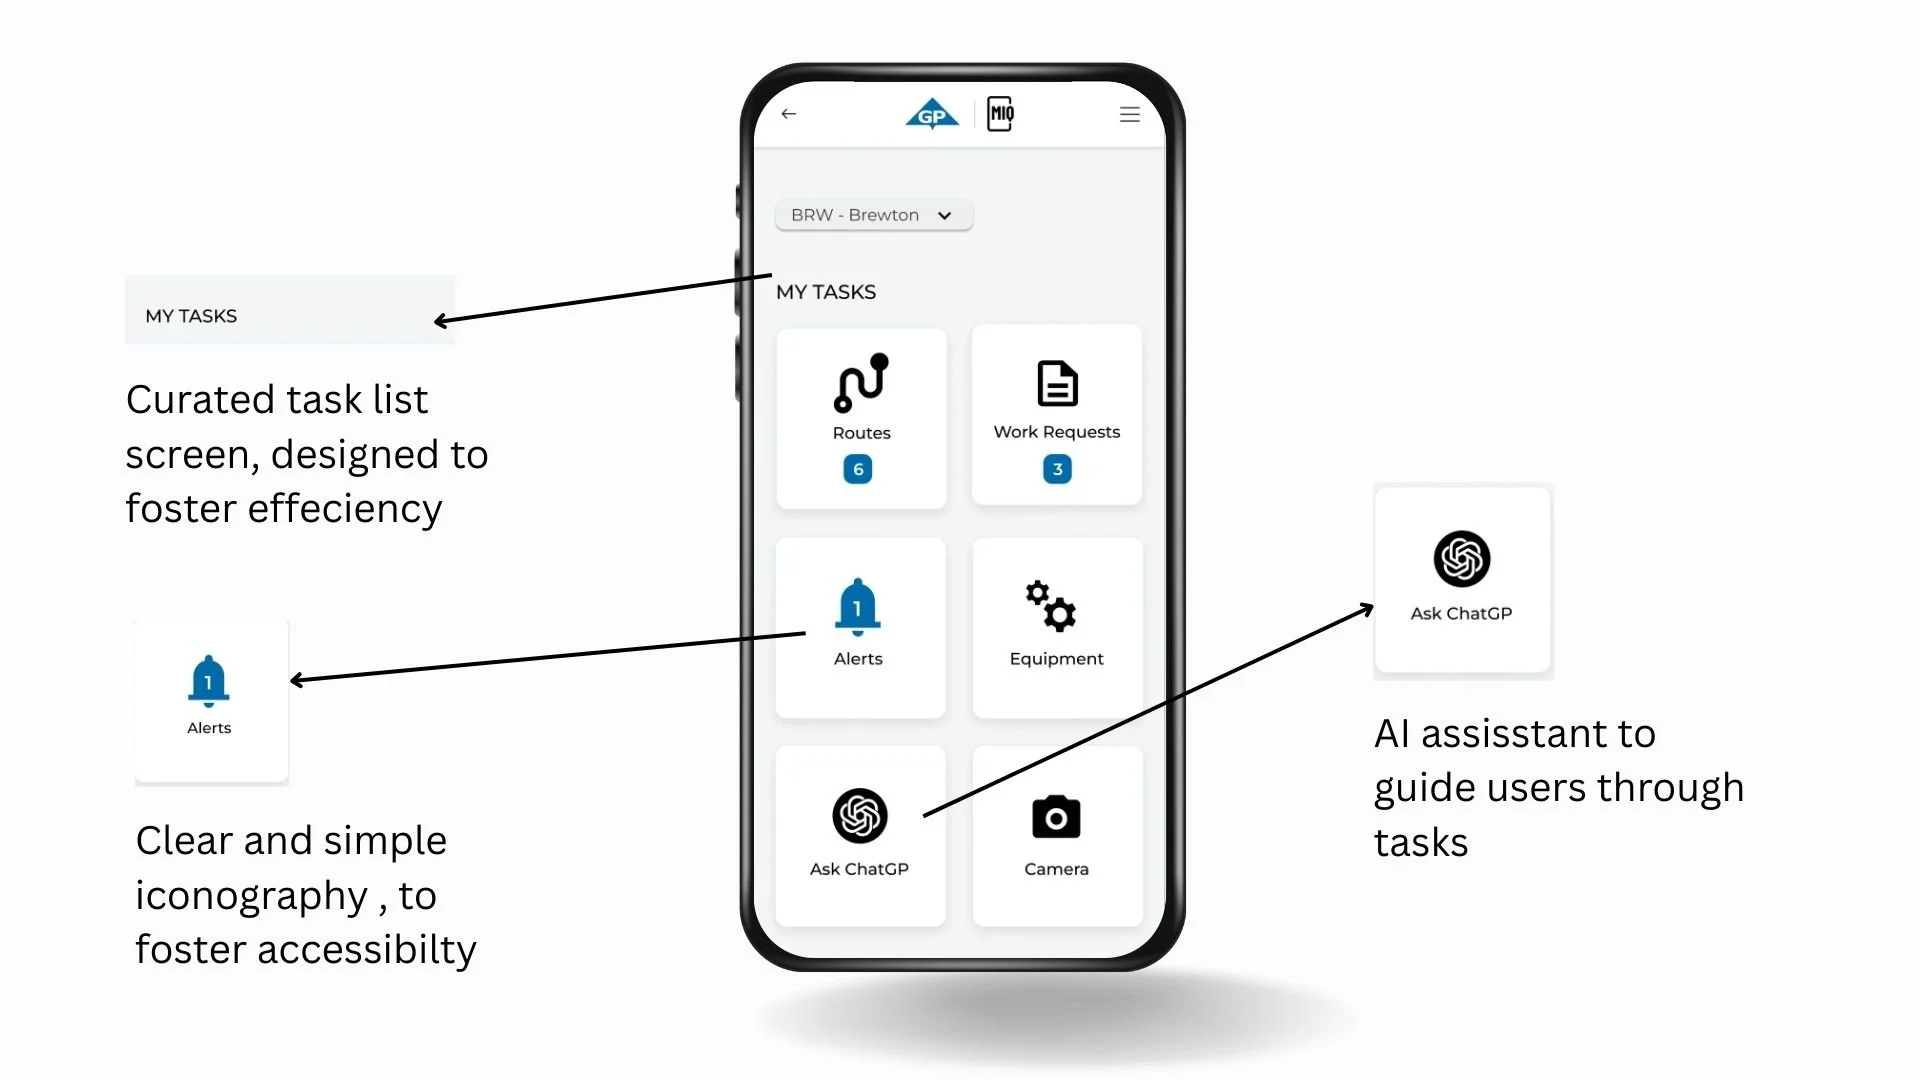
The goal : Deliver an intuitive and accessible mobile dashboard that enhances efficiency and ROI.
Research & Discovery
My visit to Brewton

I conducted an on-site visit to the Brewton facility, engaging directly with a diverse group of factory workers through interviews and observations

This hands-on approach revealed common frustrations, such as the time lost in manual documentation and the cognitive load of juggling paper records with operational duties.
Interview Data
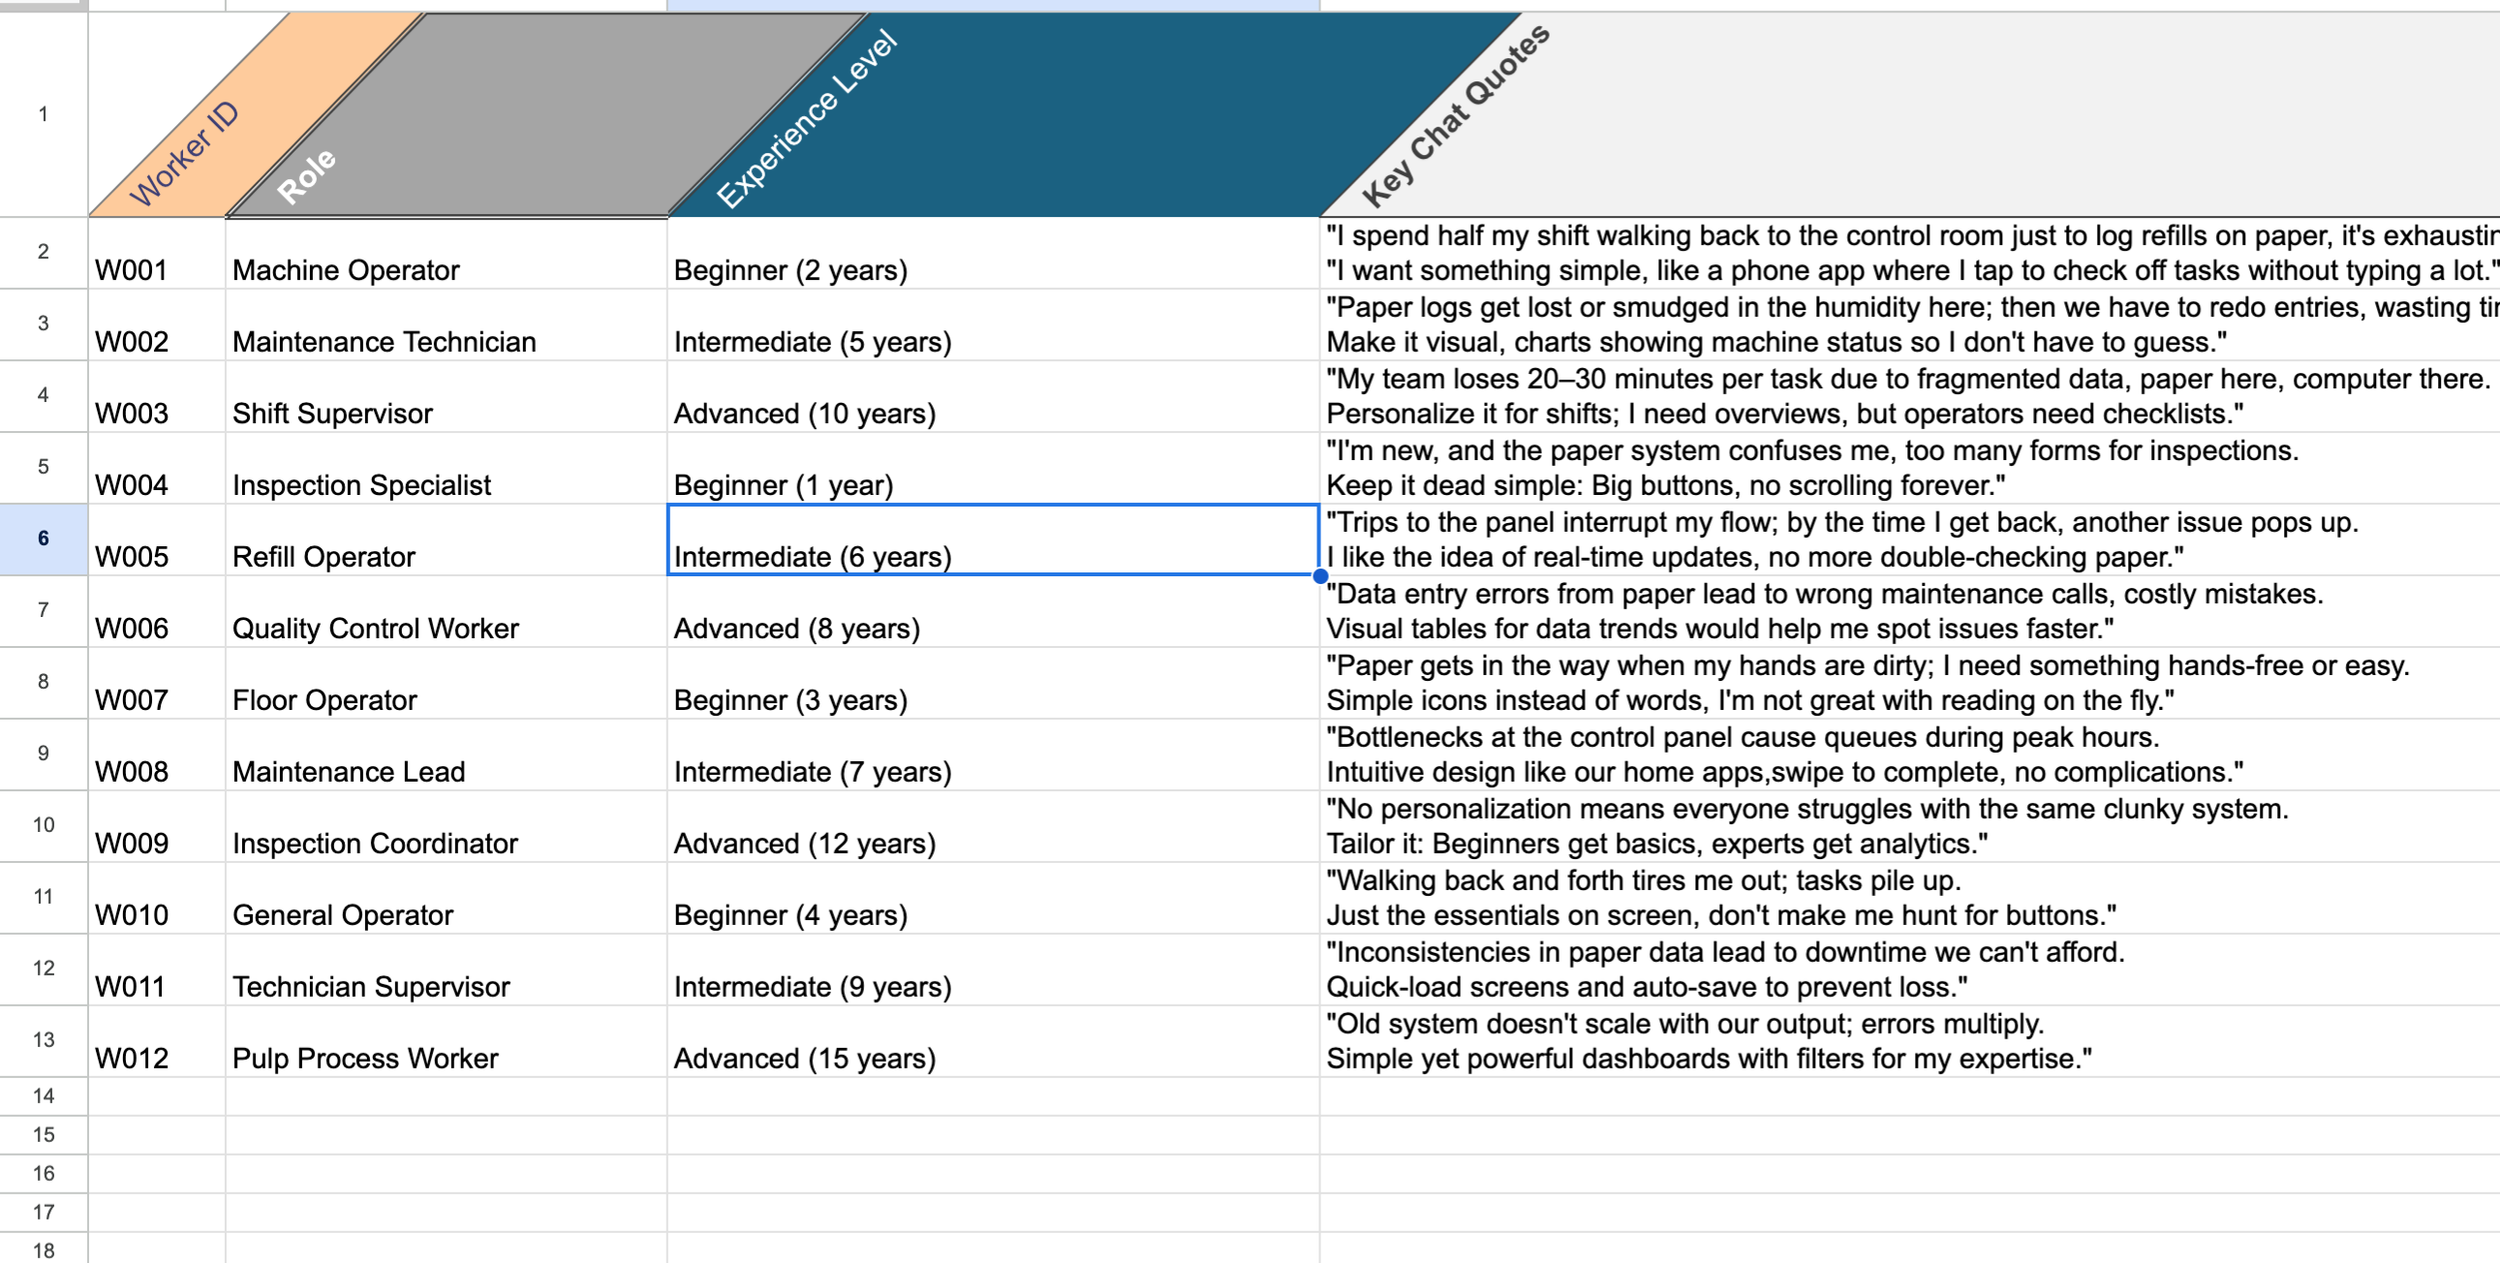
Analyzed data to identify common themes, crafting a clear problem statement shared with stakeholders for alignment.
Theme Analysis Summary
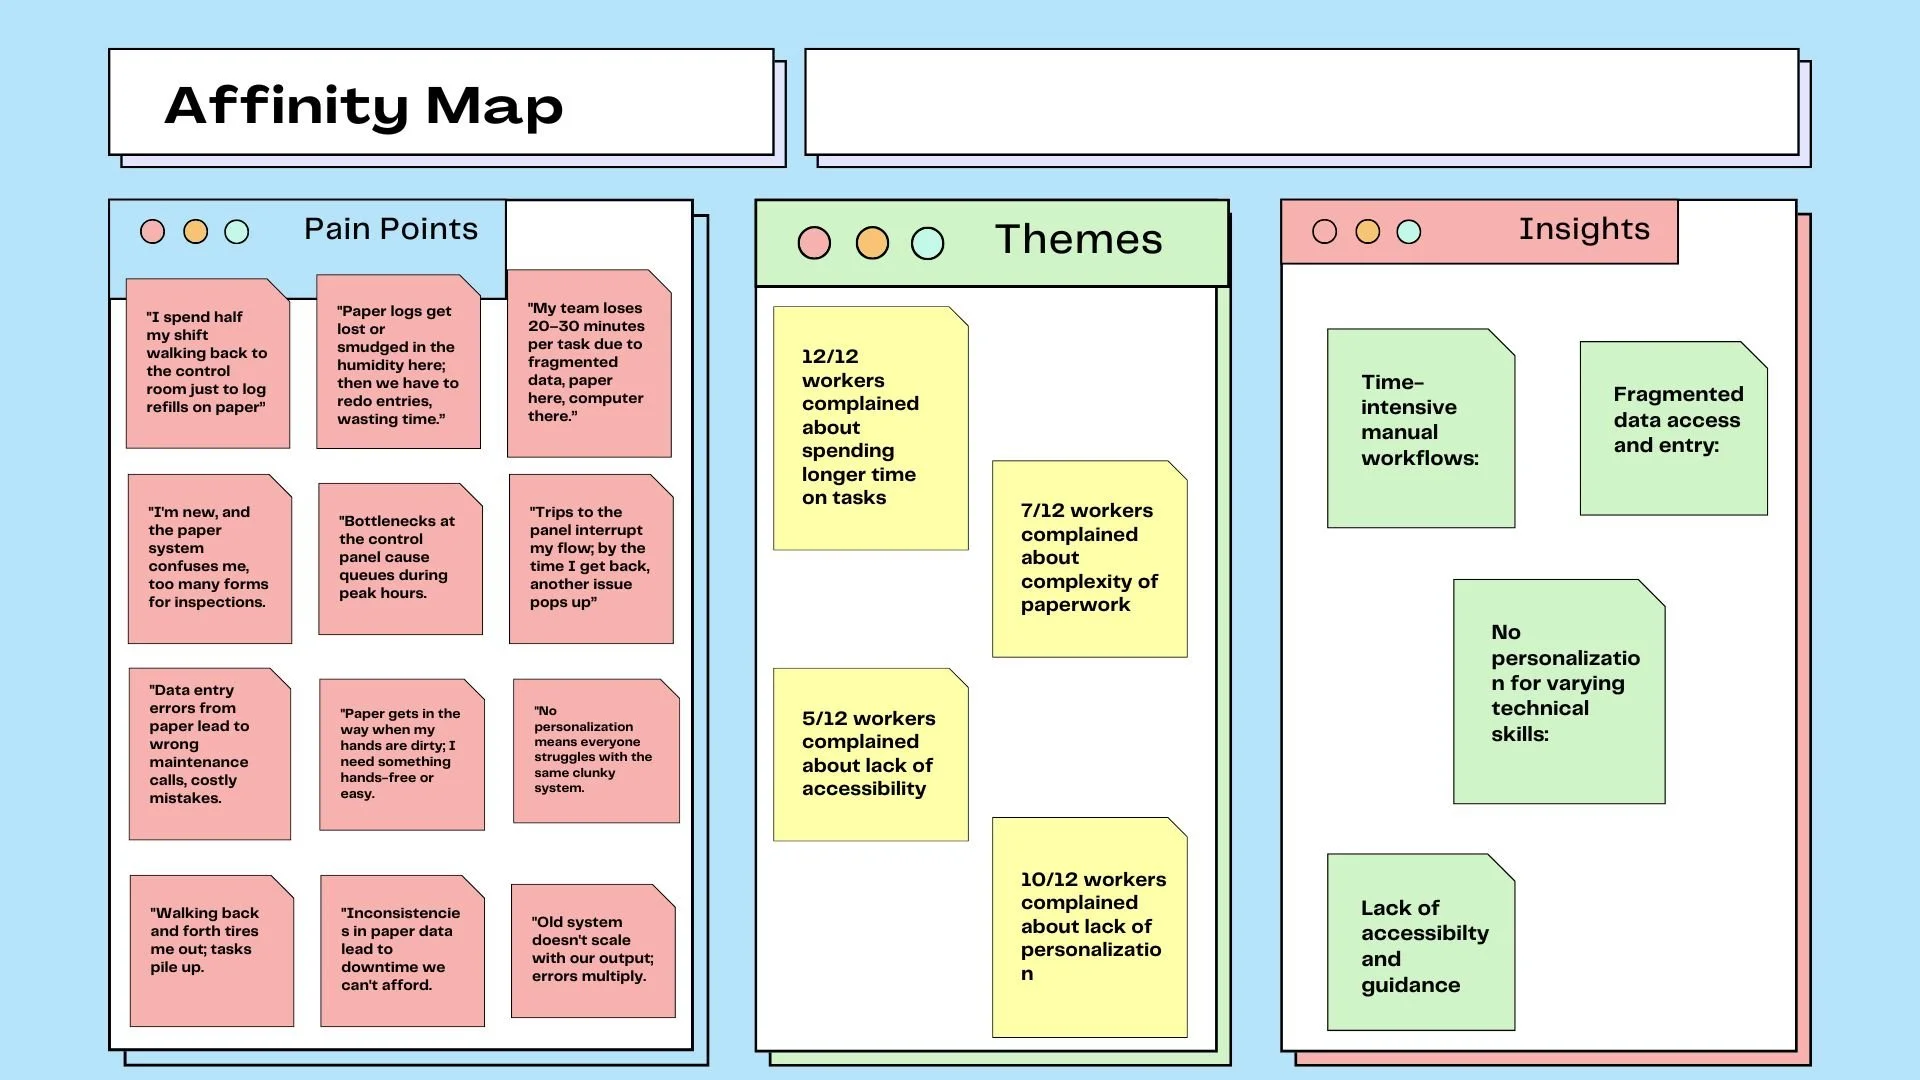
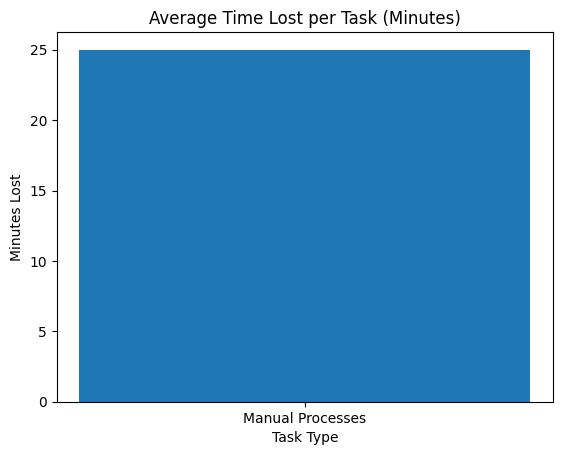
Bottlenecks: 100% of workers mentioned time loss from manual processes (avg. 20-30 mins/task). Physical trips and error-prone entry dominant.
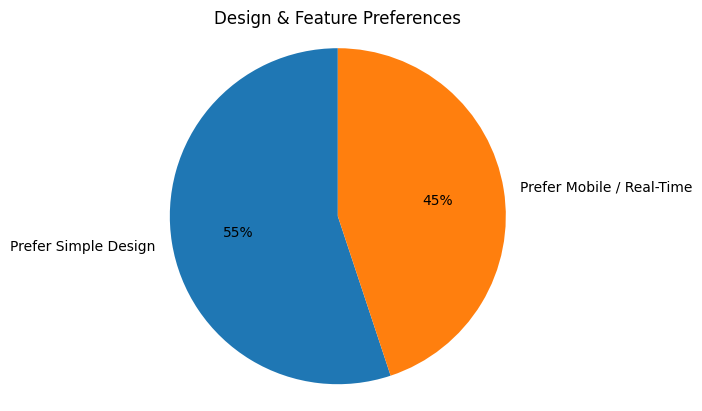
Simplicity Preferences: 55% favored intuitive, minimal designs (e.g., big buttons, visuals, personalization). 45% requested mobile/real-time features.
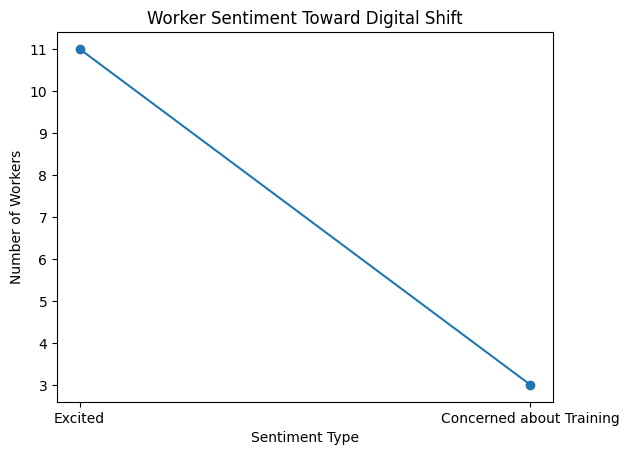
Overall Sentiment: Positive toward digital shift (11/12 excited); concerns about training (3 mentions).
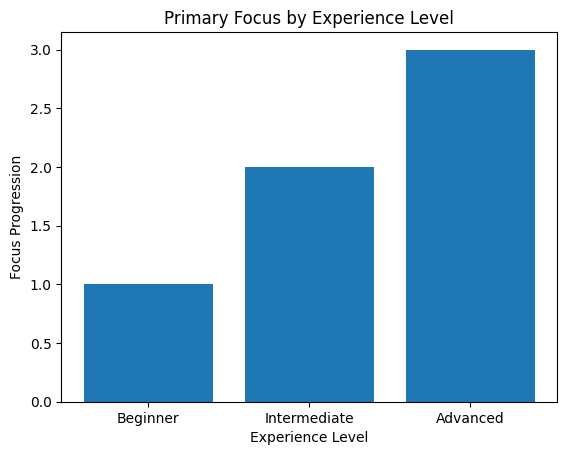
Diversity Insights: Beginners (n=4) focused on ease; Intermediates (n=4) on efficiency; Advanced (n=4) on customization.
Based on the research, I created five personas representing the spectrum of factory workers' technical proficiency and interaction styles.
Persona Development

Design & Ideation
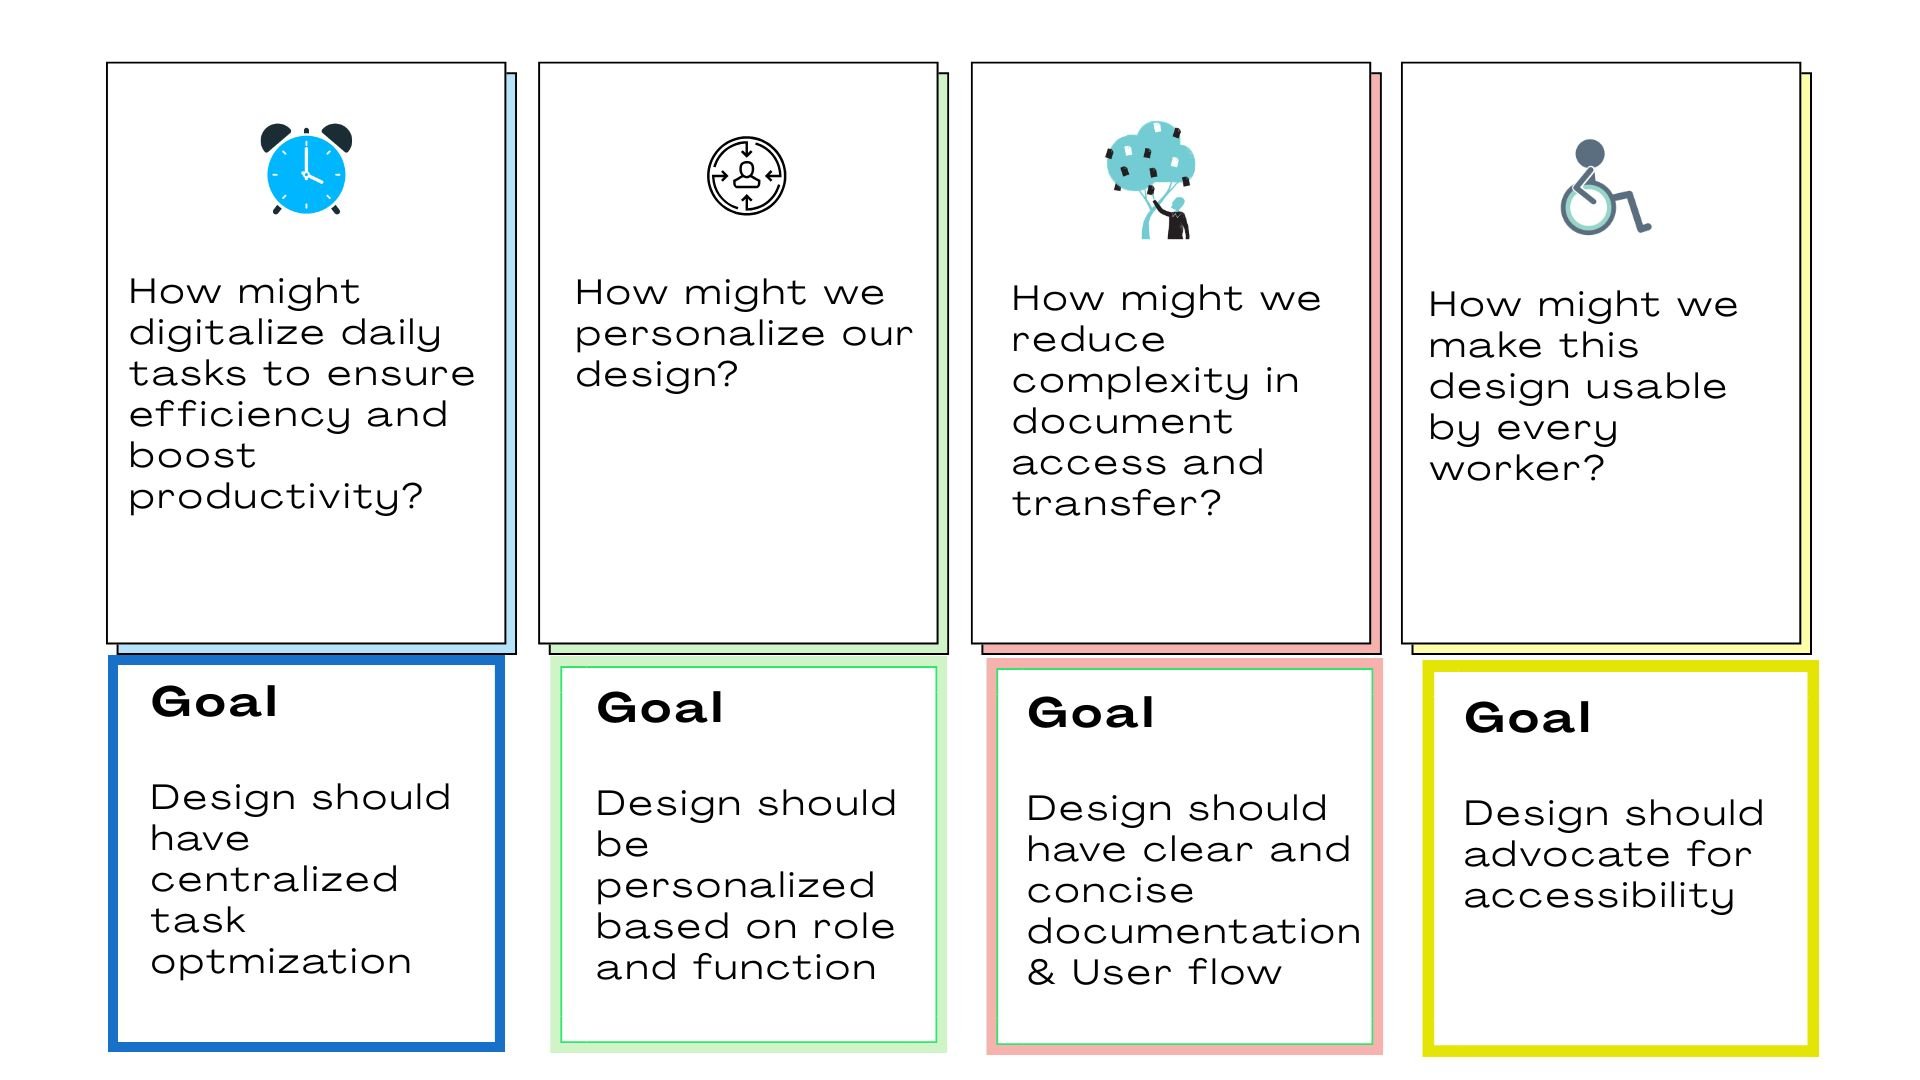
HMWs
Approved by Cross-functional Team
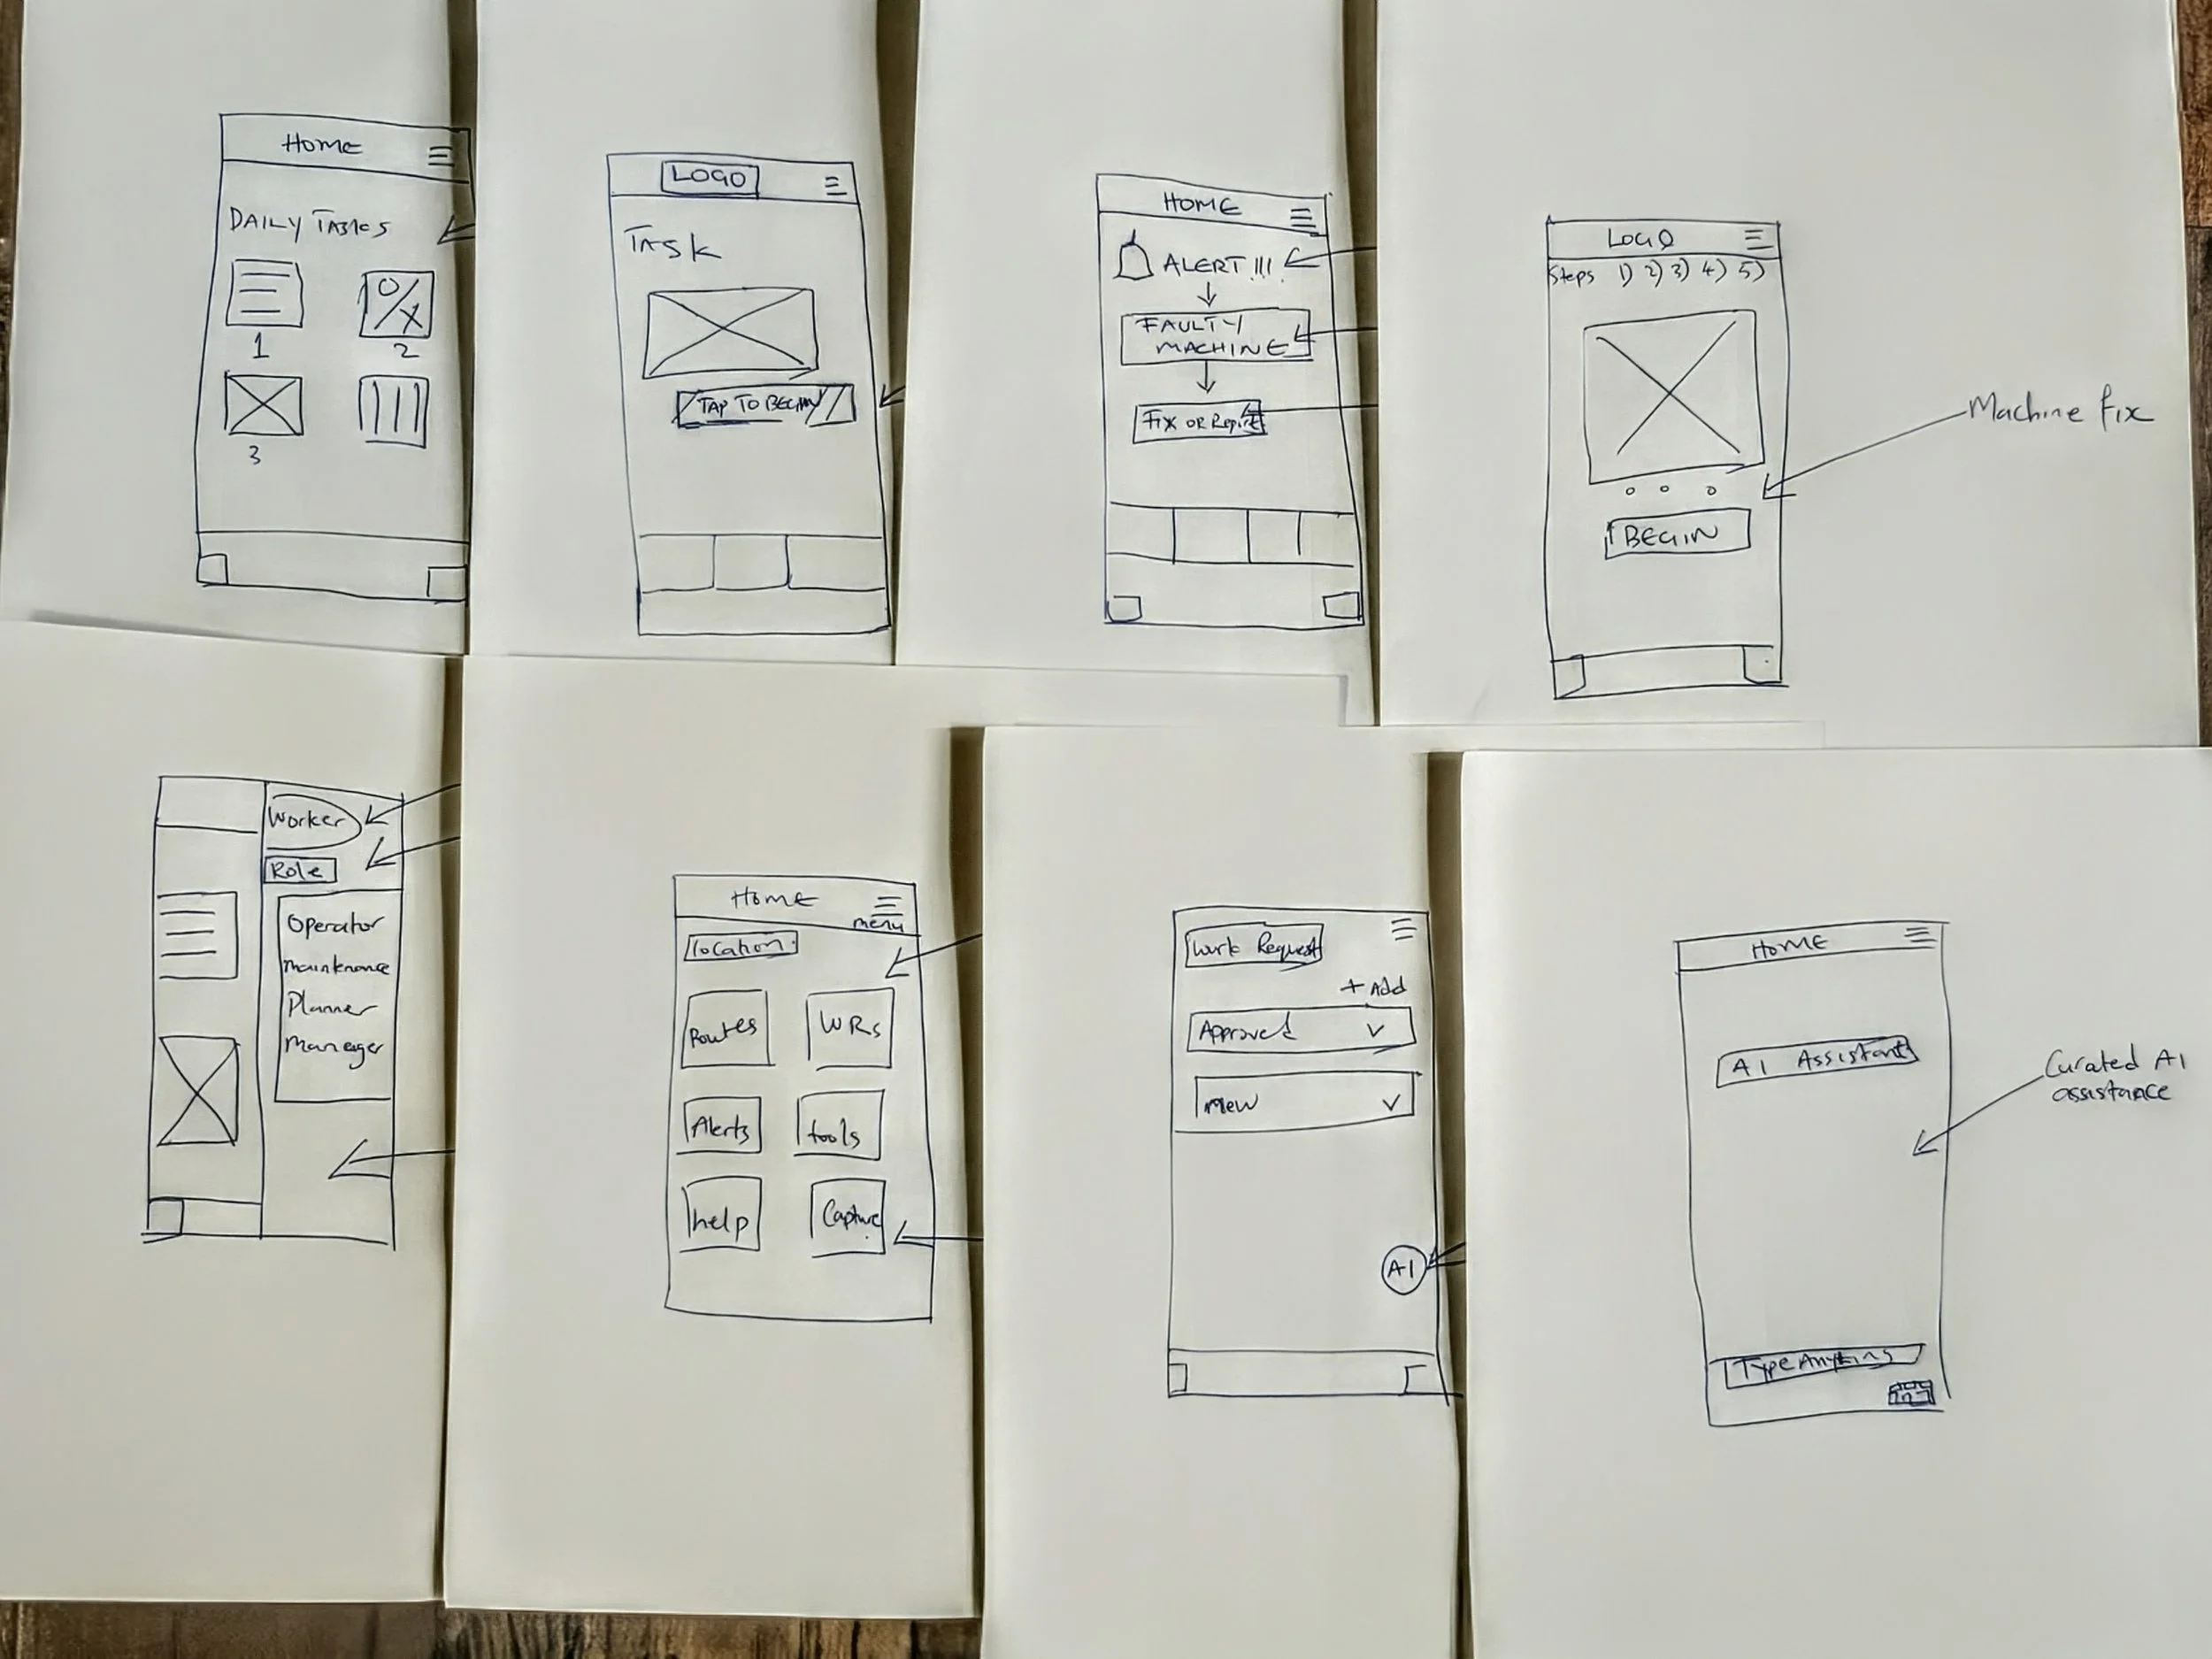
I conducted a Crazy 8s exercise to get an early feel for addressing the users’ needs. These sketches drew direct inspiration from the user interview pain points; Centralization, Personalization and simplicity.
Crazy 8s Exercise
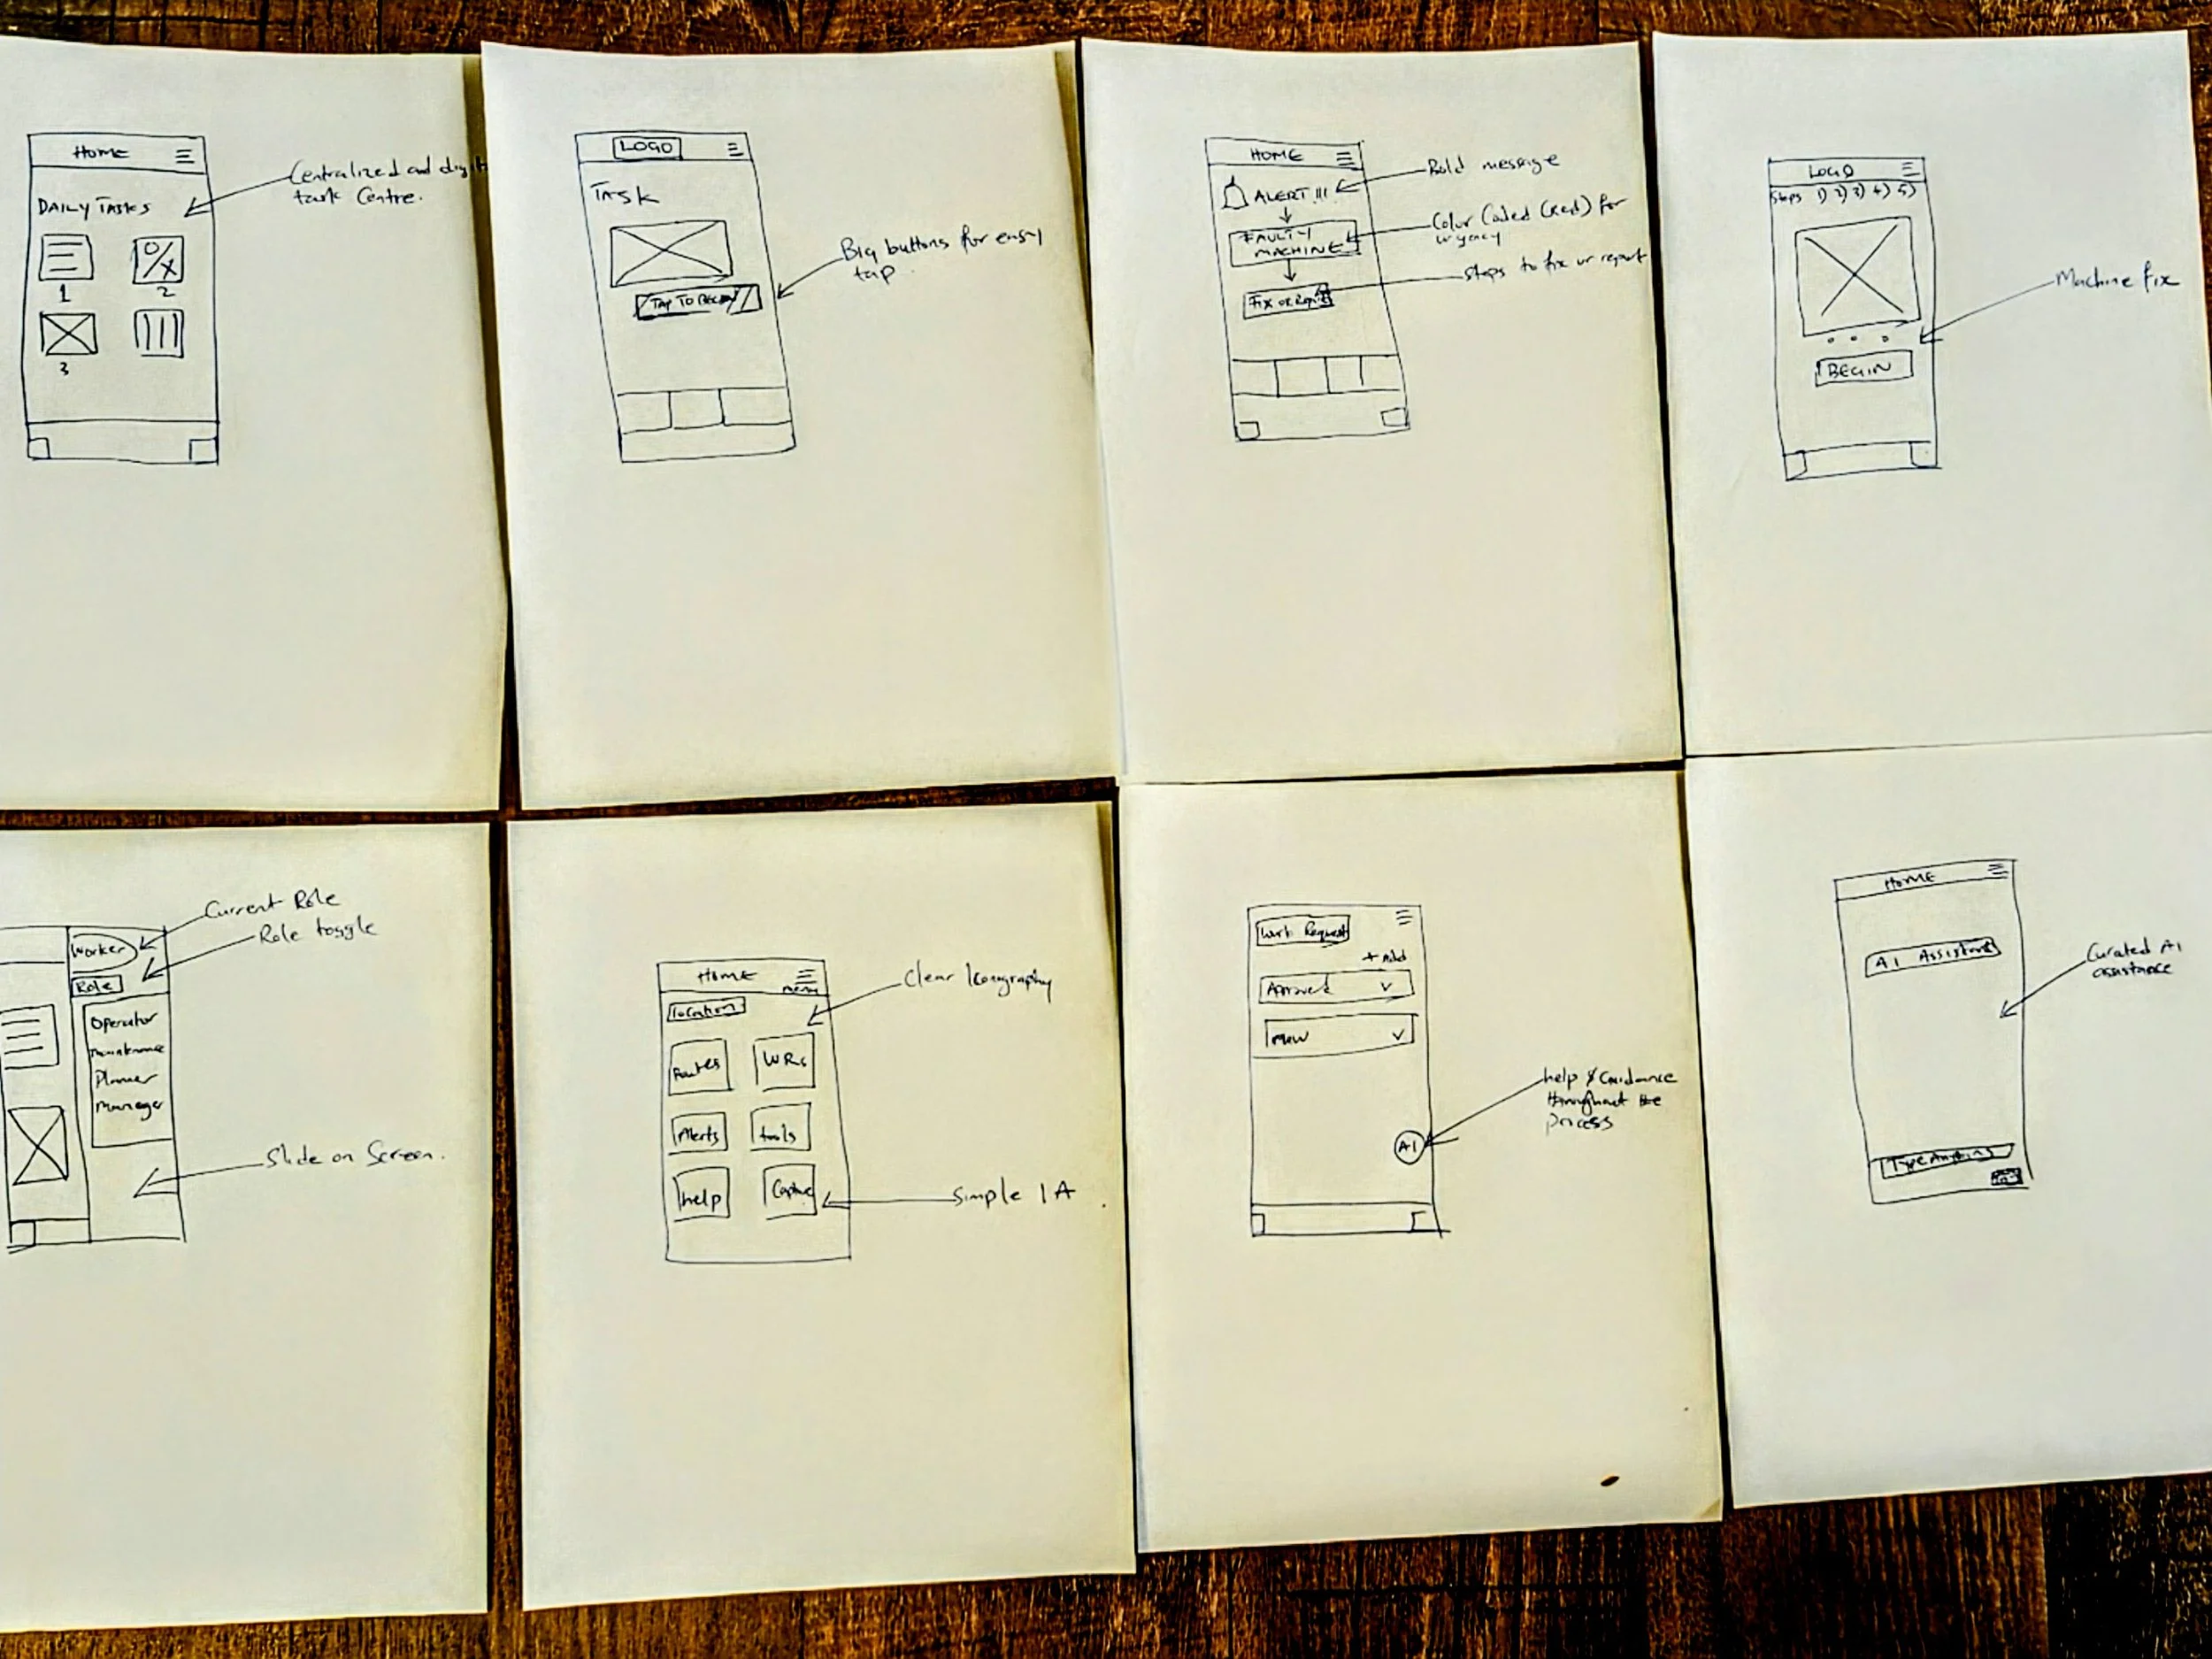
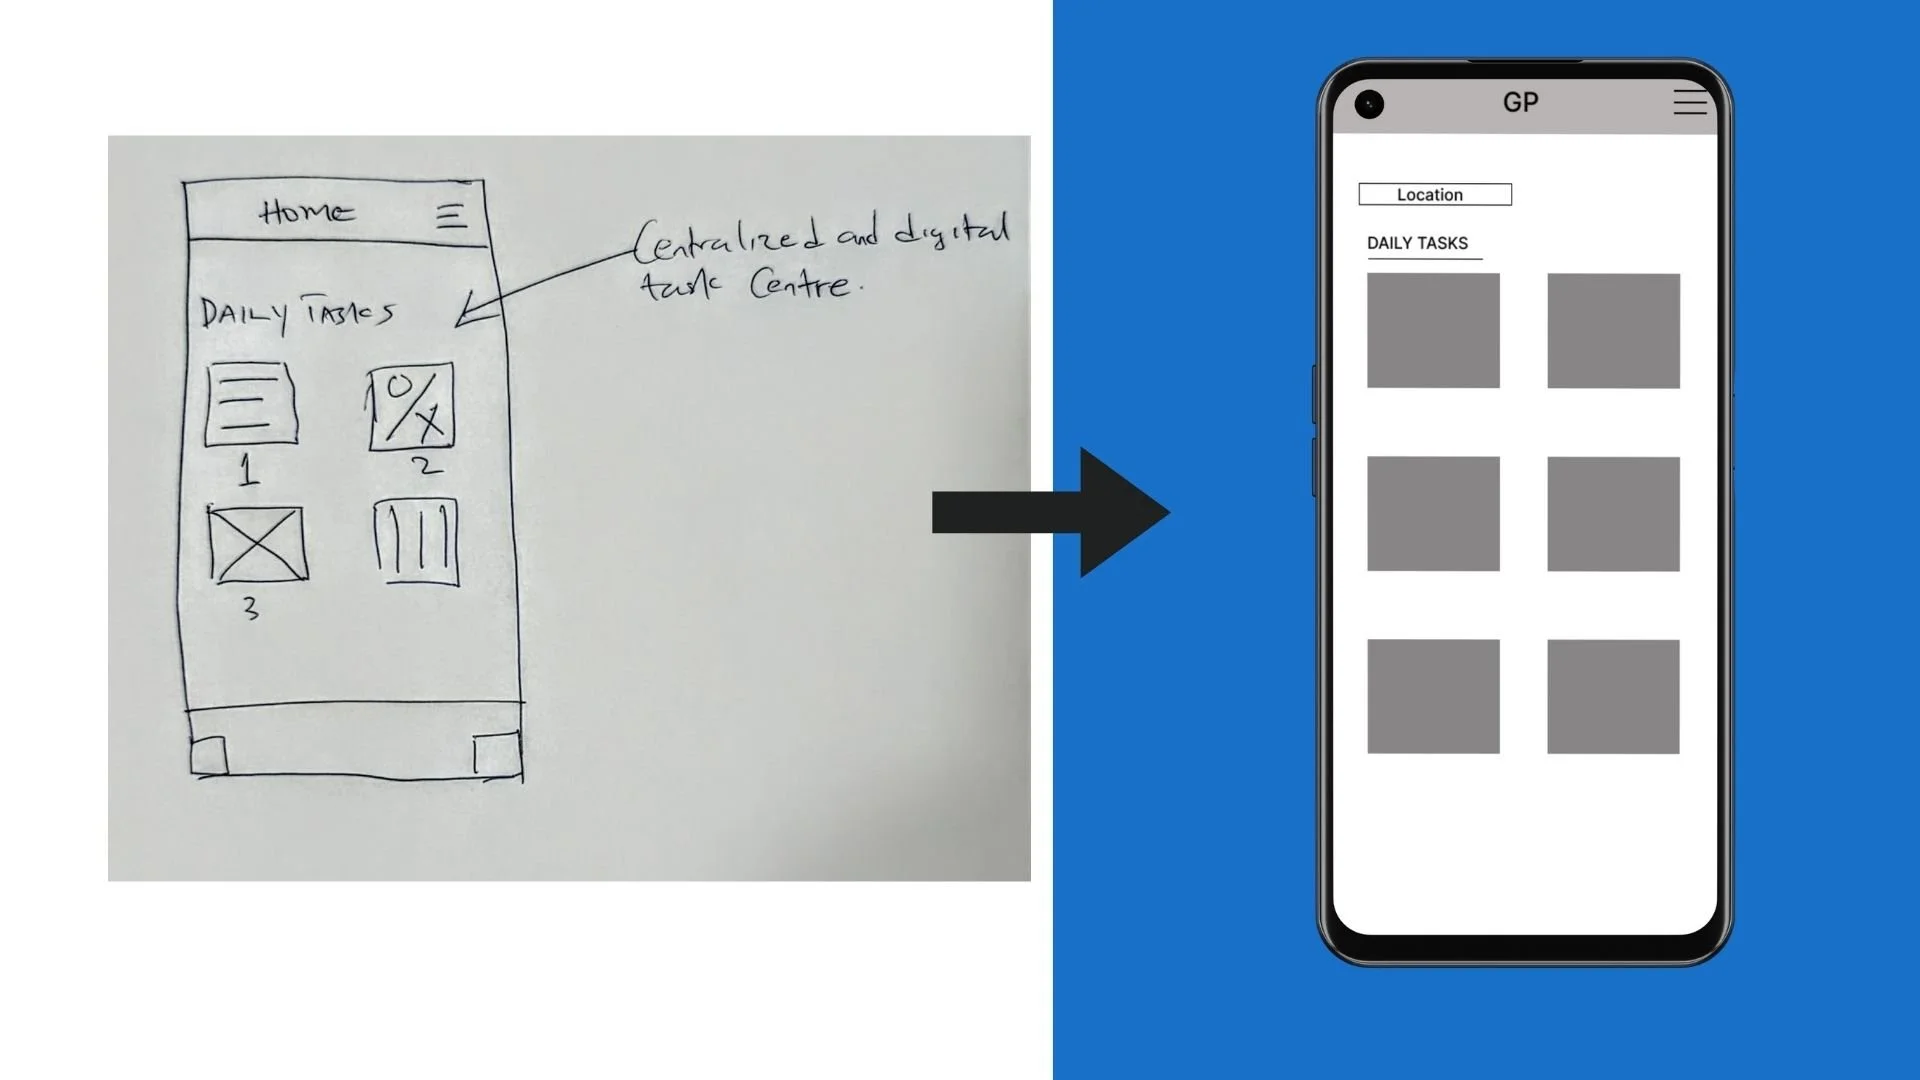
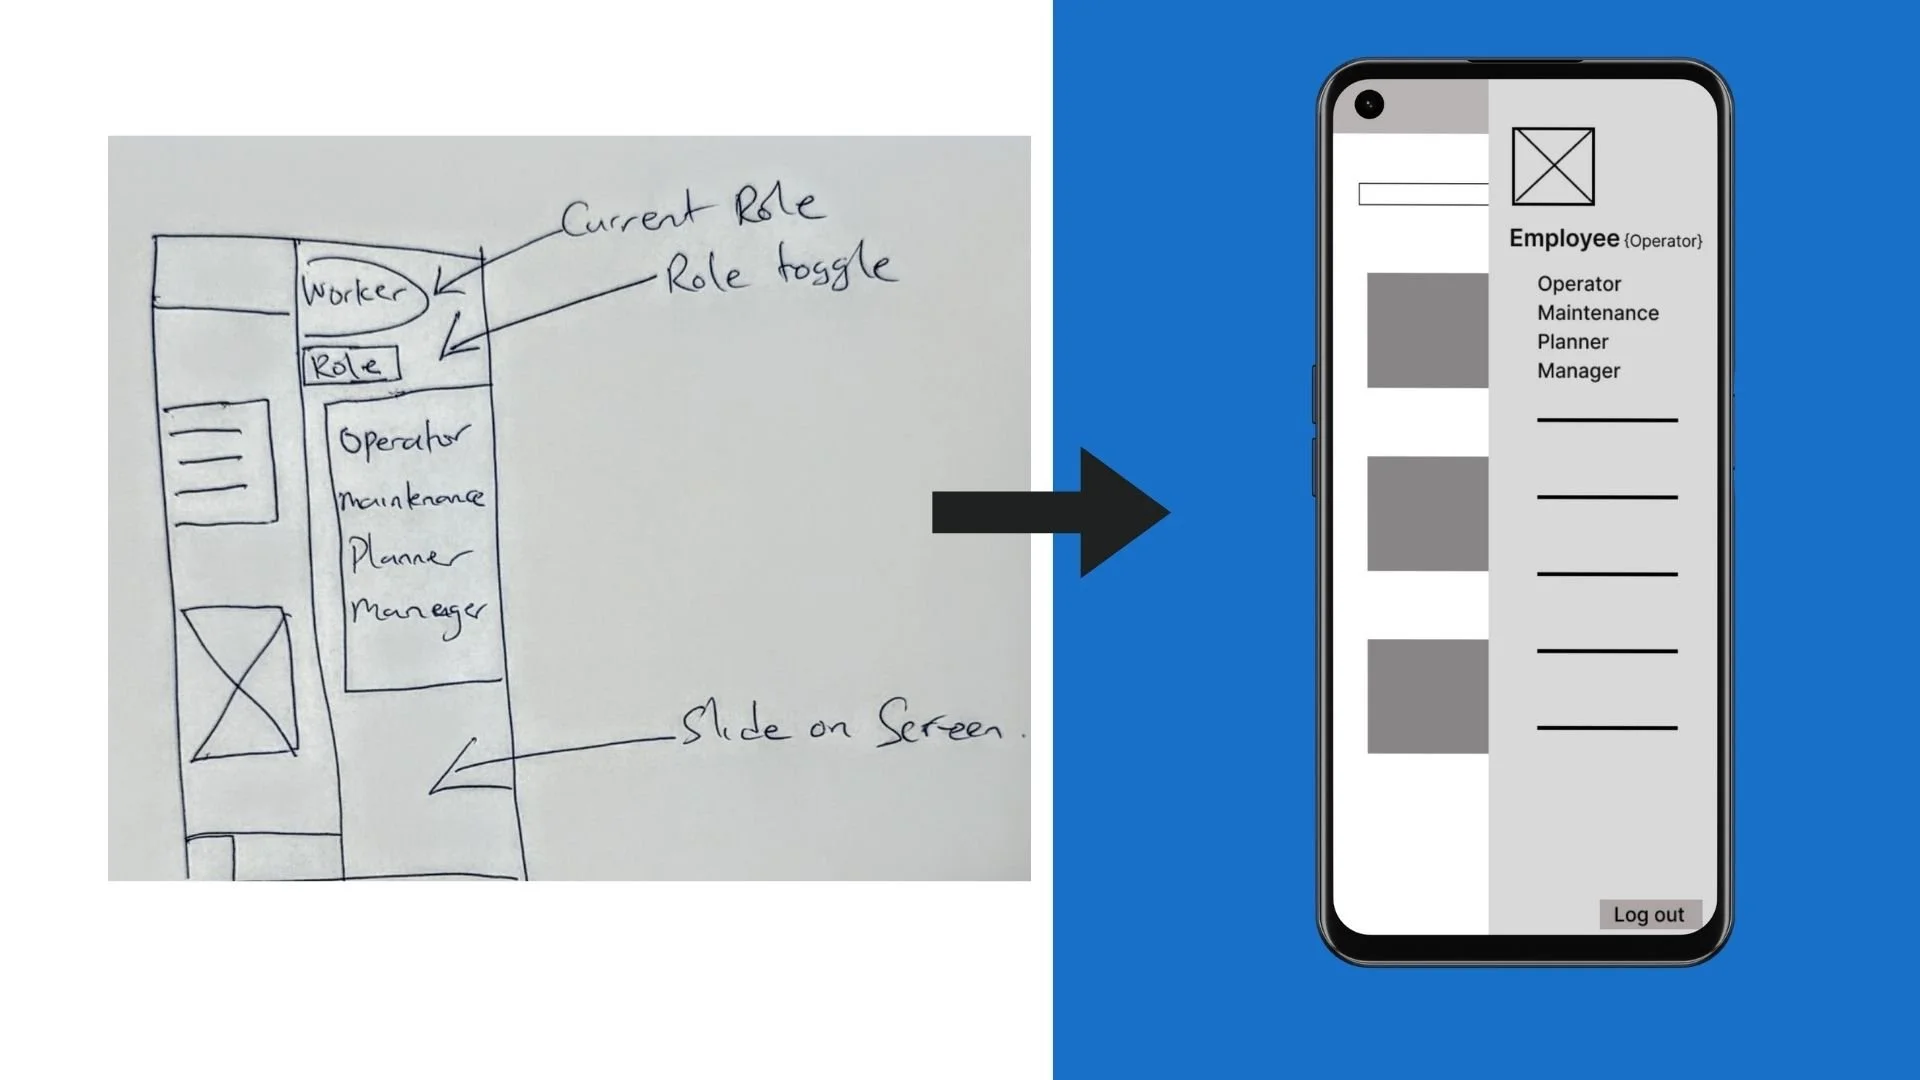
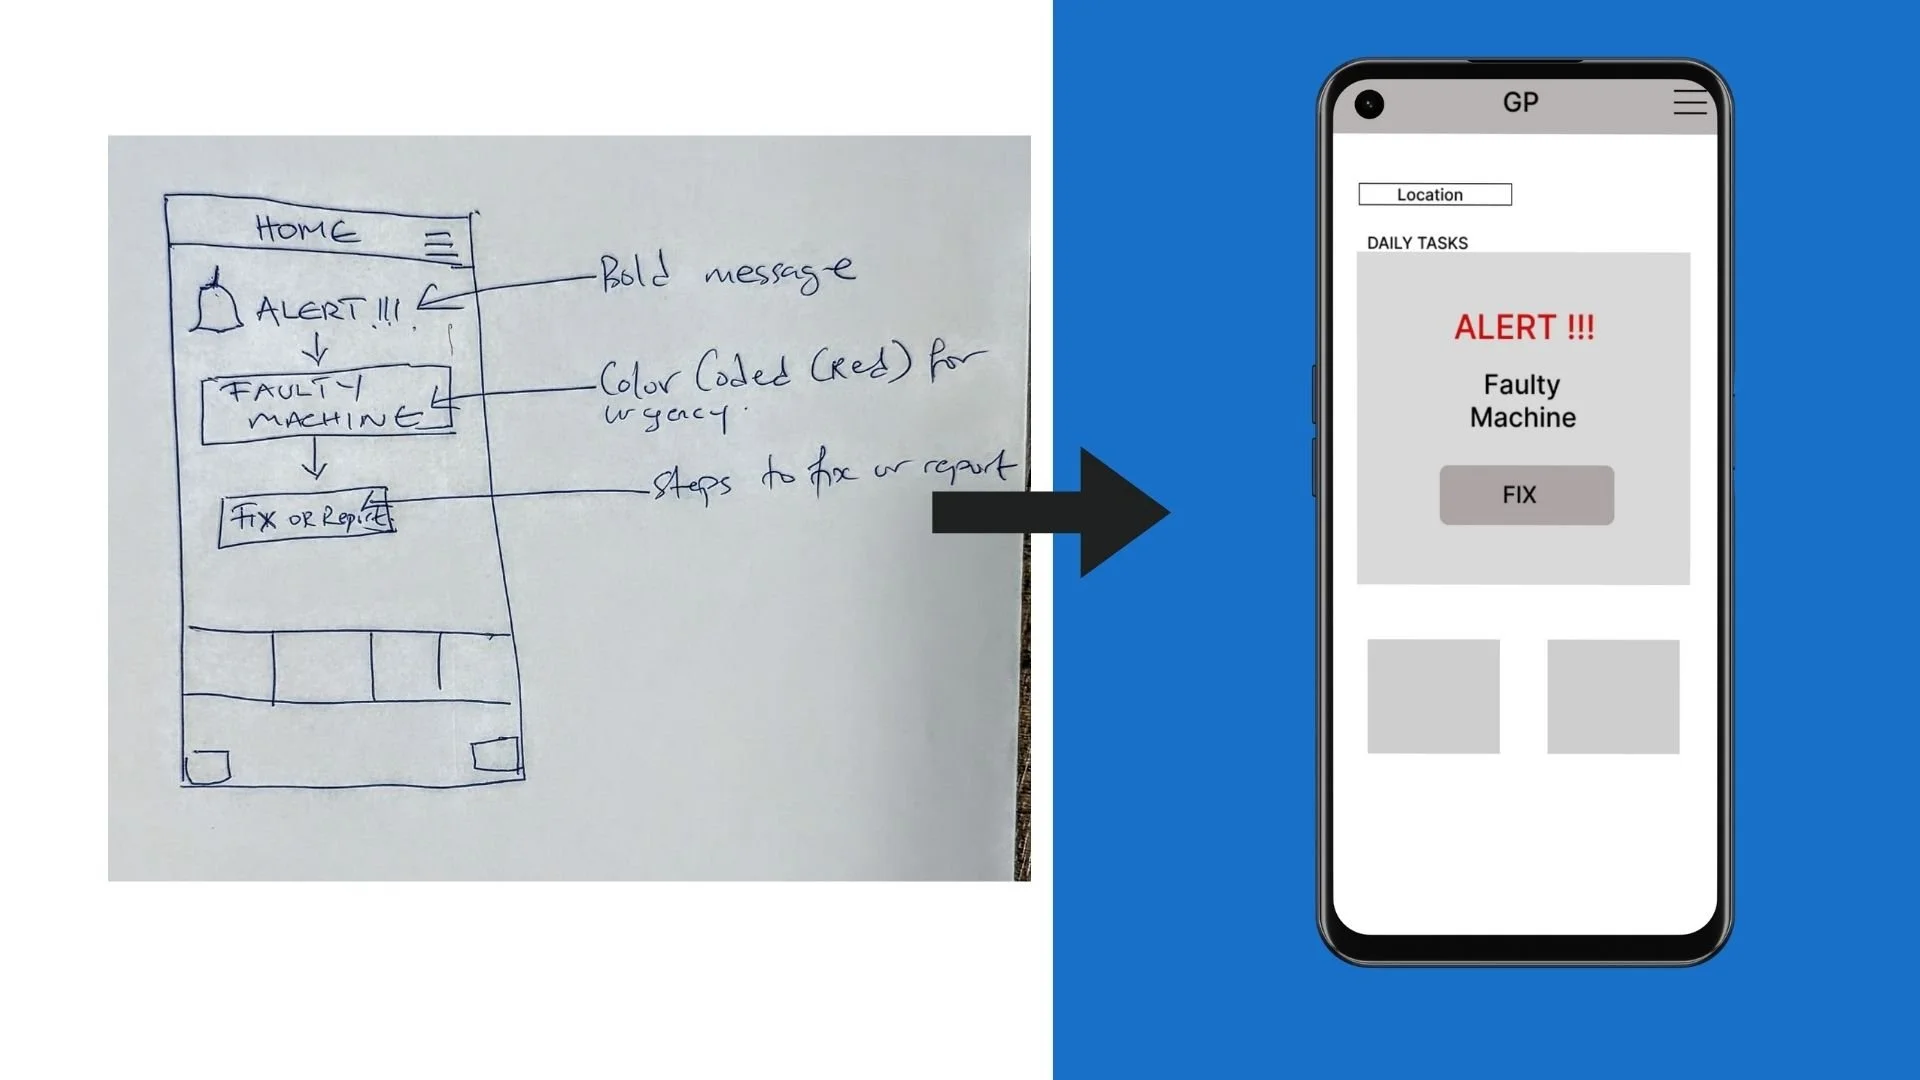
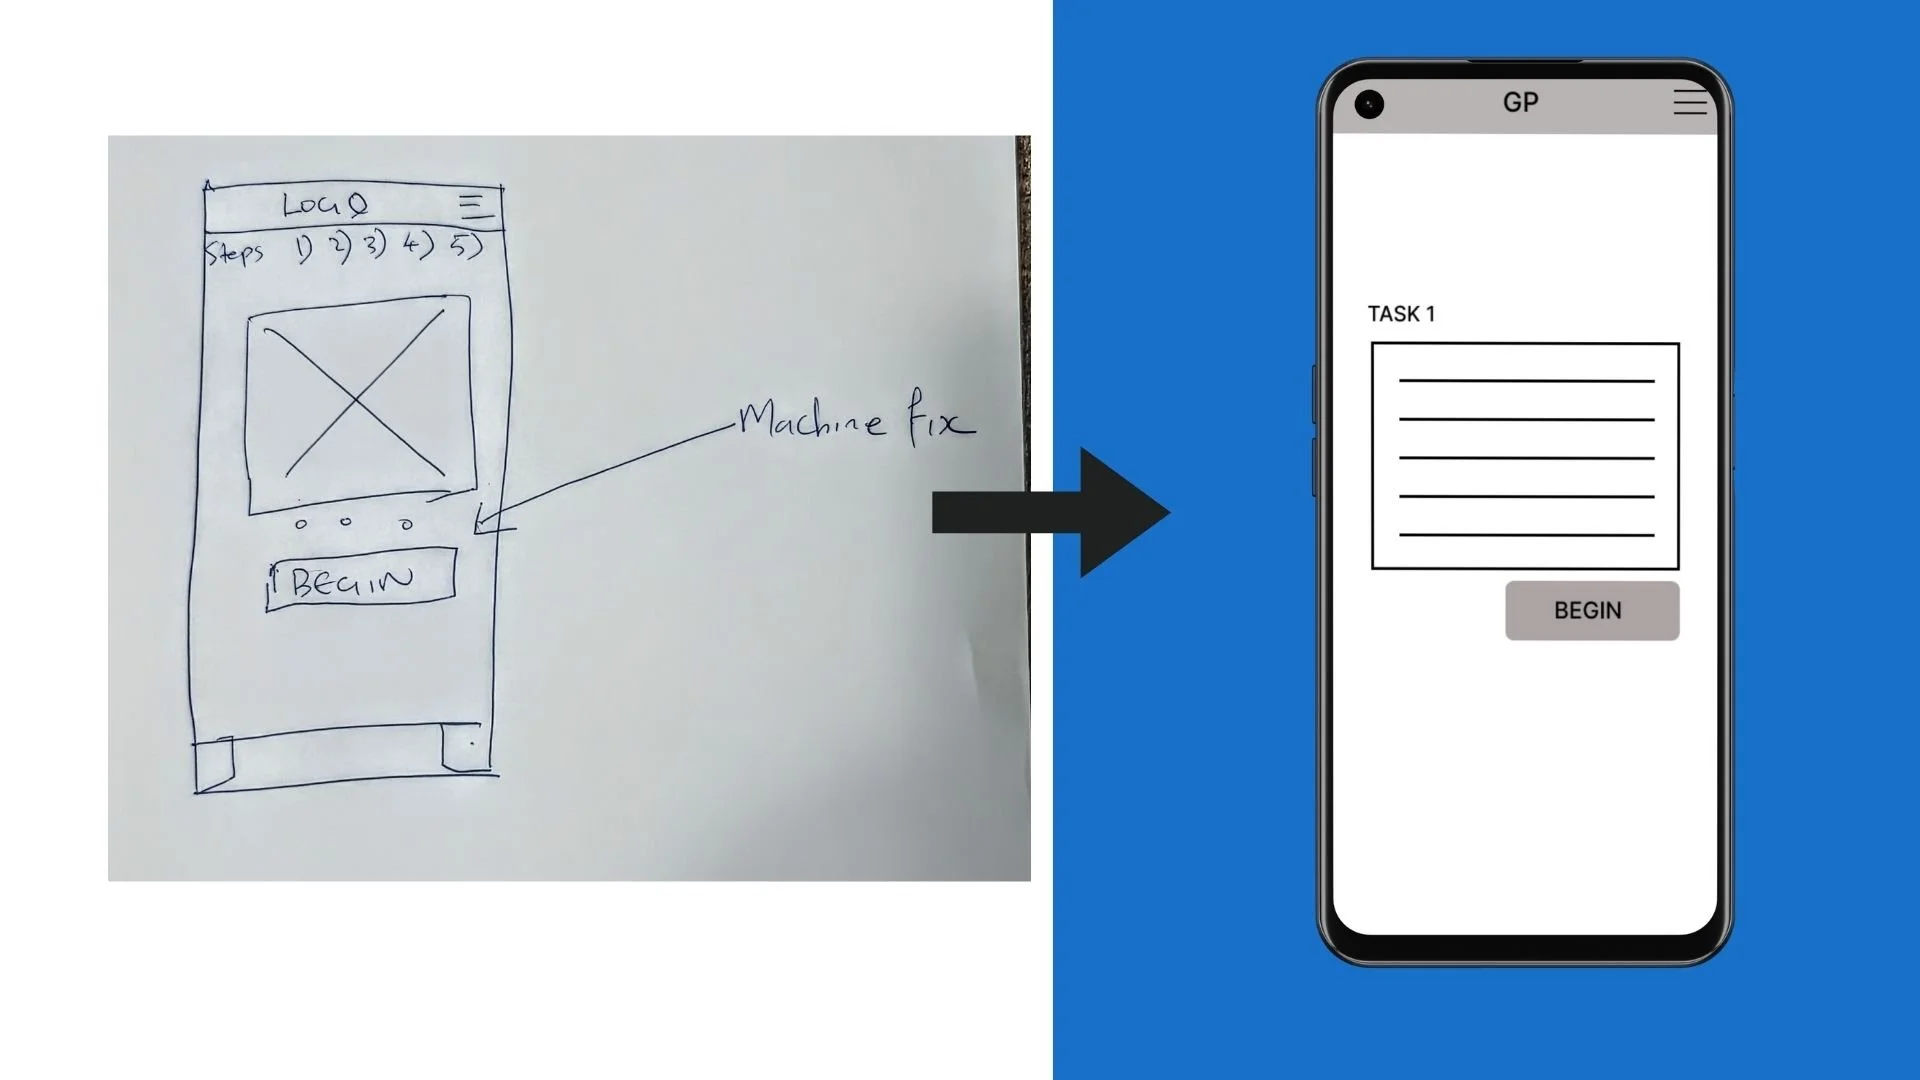
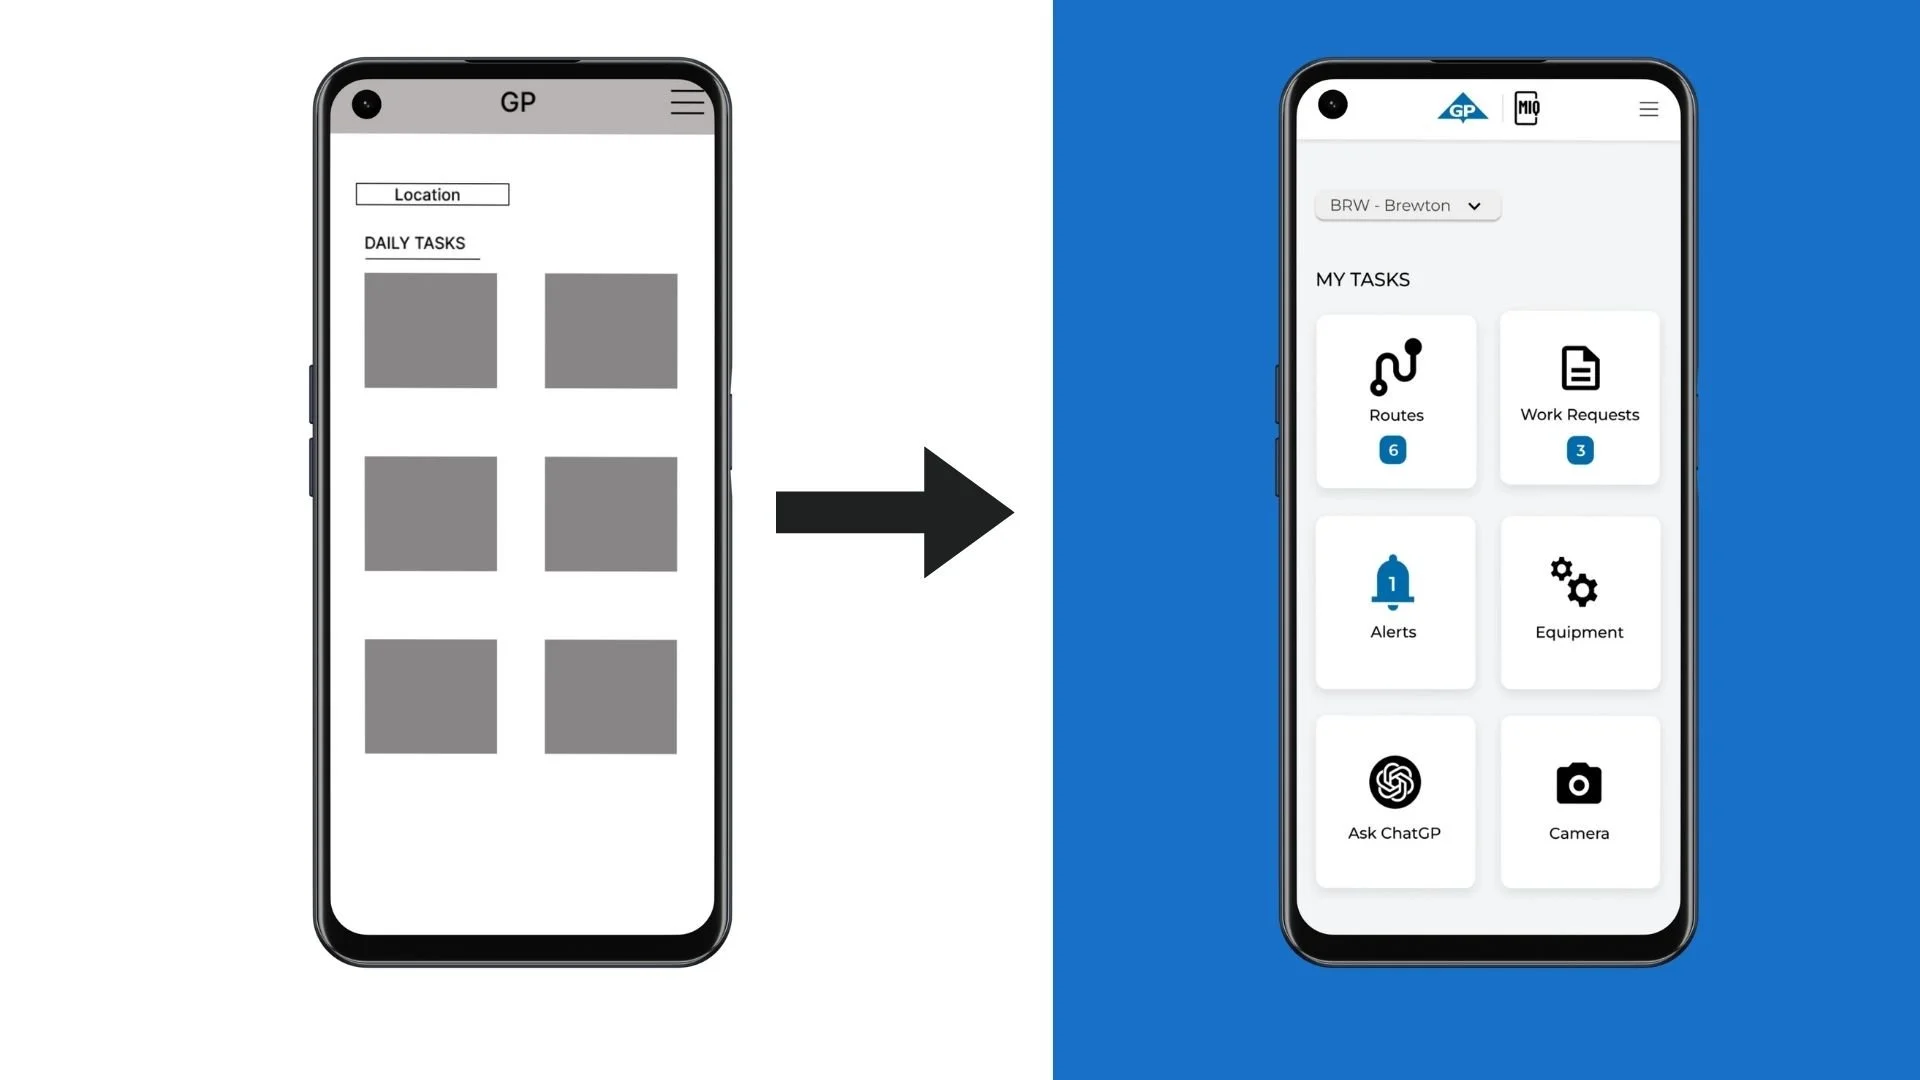
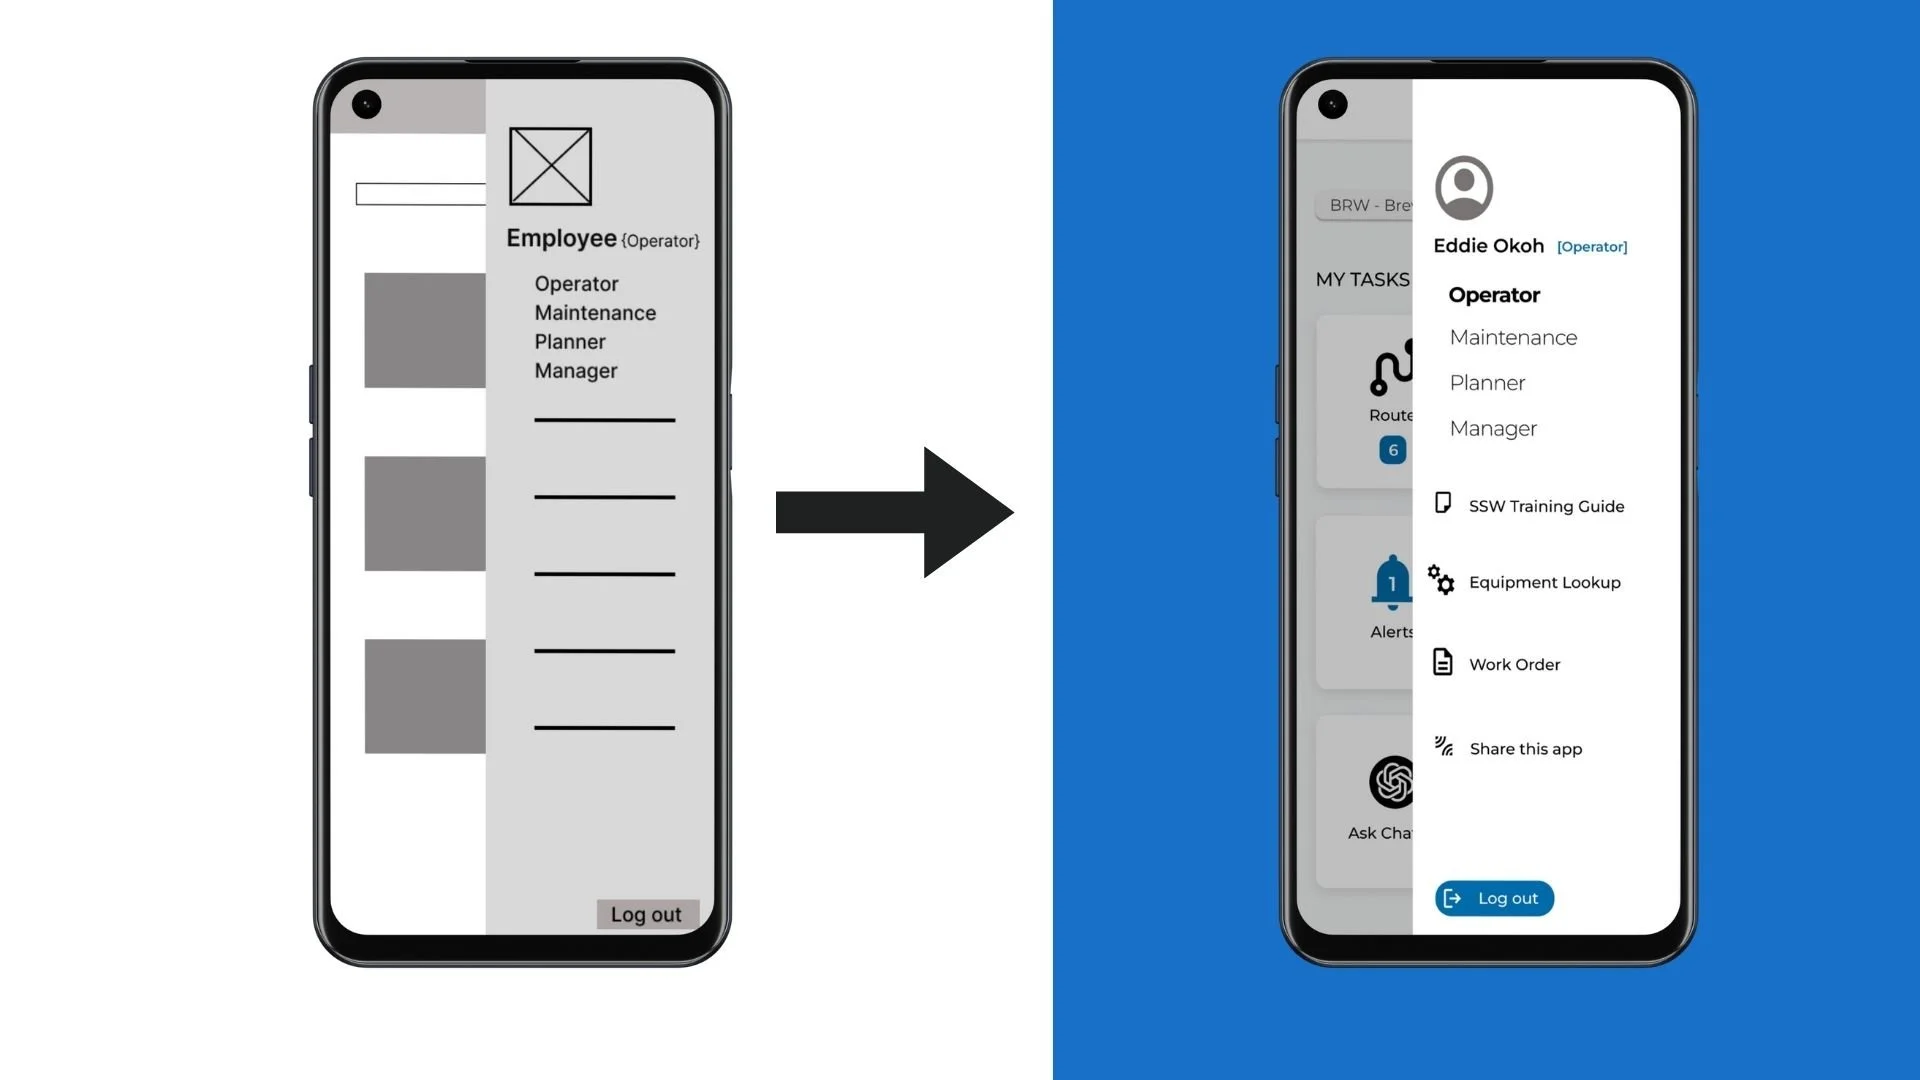
After sketching the wireframes by hand, it was now time to go into Figma to begin designing the low-fidelity prototypes. Keeping the Goal Statements in mind was the highest priority during this process.
From Paper to Digital
Usability Testing
The primary goal of this study was to validate the conceptual framework of the MIQ mobile interface using low-fidelity prototypes. We aimed to identify friction points in task flows and data visualization before moving into high-fidelity production.

After receiving the raw data from the unmoderated Usability testing, I analyzed the participants' feedback, paying close attention to their honest criticisms and recommendations to improve and streamline MIQ.
Feedback & Analysis
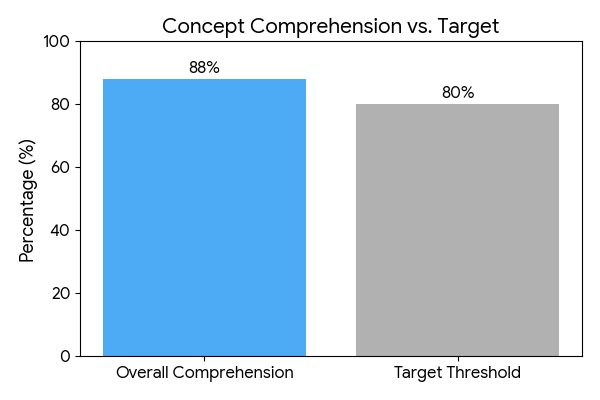
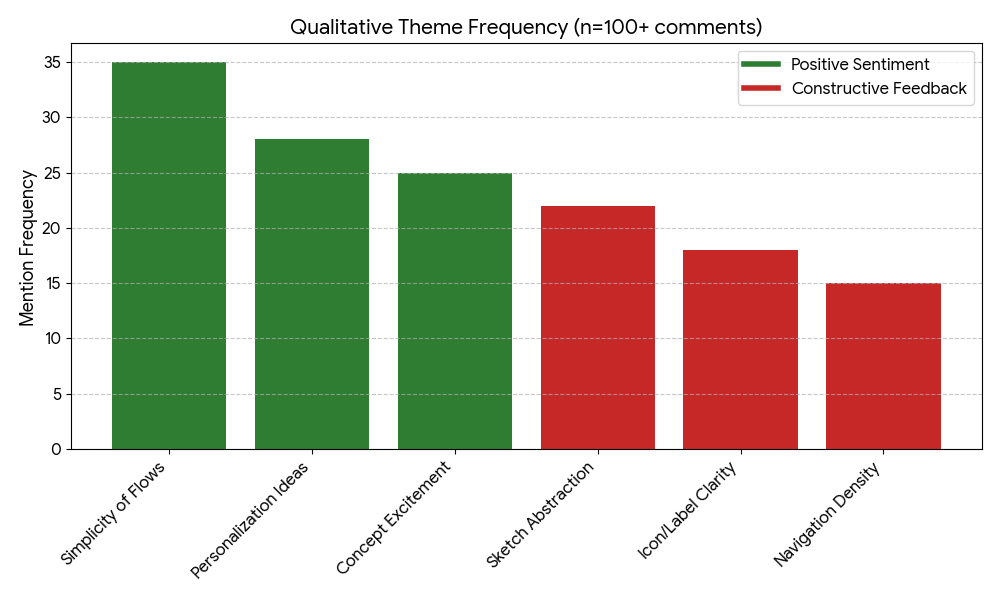
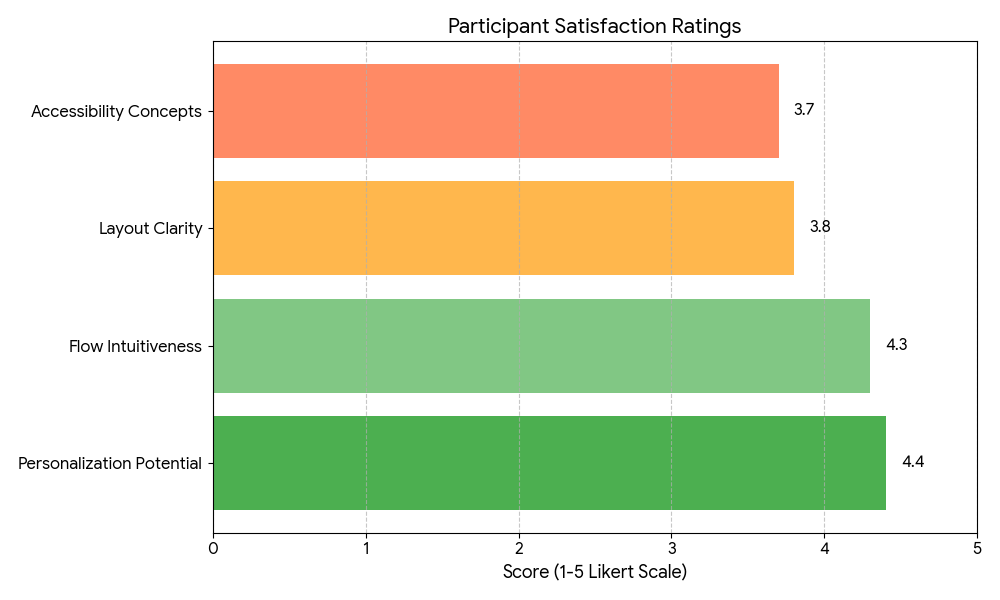
Strengths: Participants appreciated the conceptual shift from paper to digital, with strong approval for centralized task dashboards and role-based personalization. Basic wireframes effectively conveyed efficiency gains.
Pain Points:
Abstract Representation: Low-fi sketches were hard for low-tech users to visualize (e.g., data charts as "lines" lacked context).
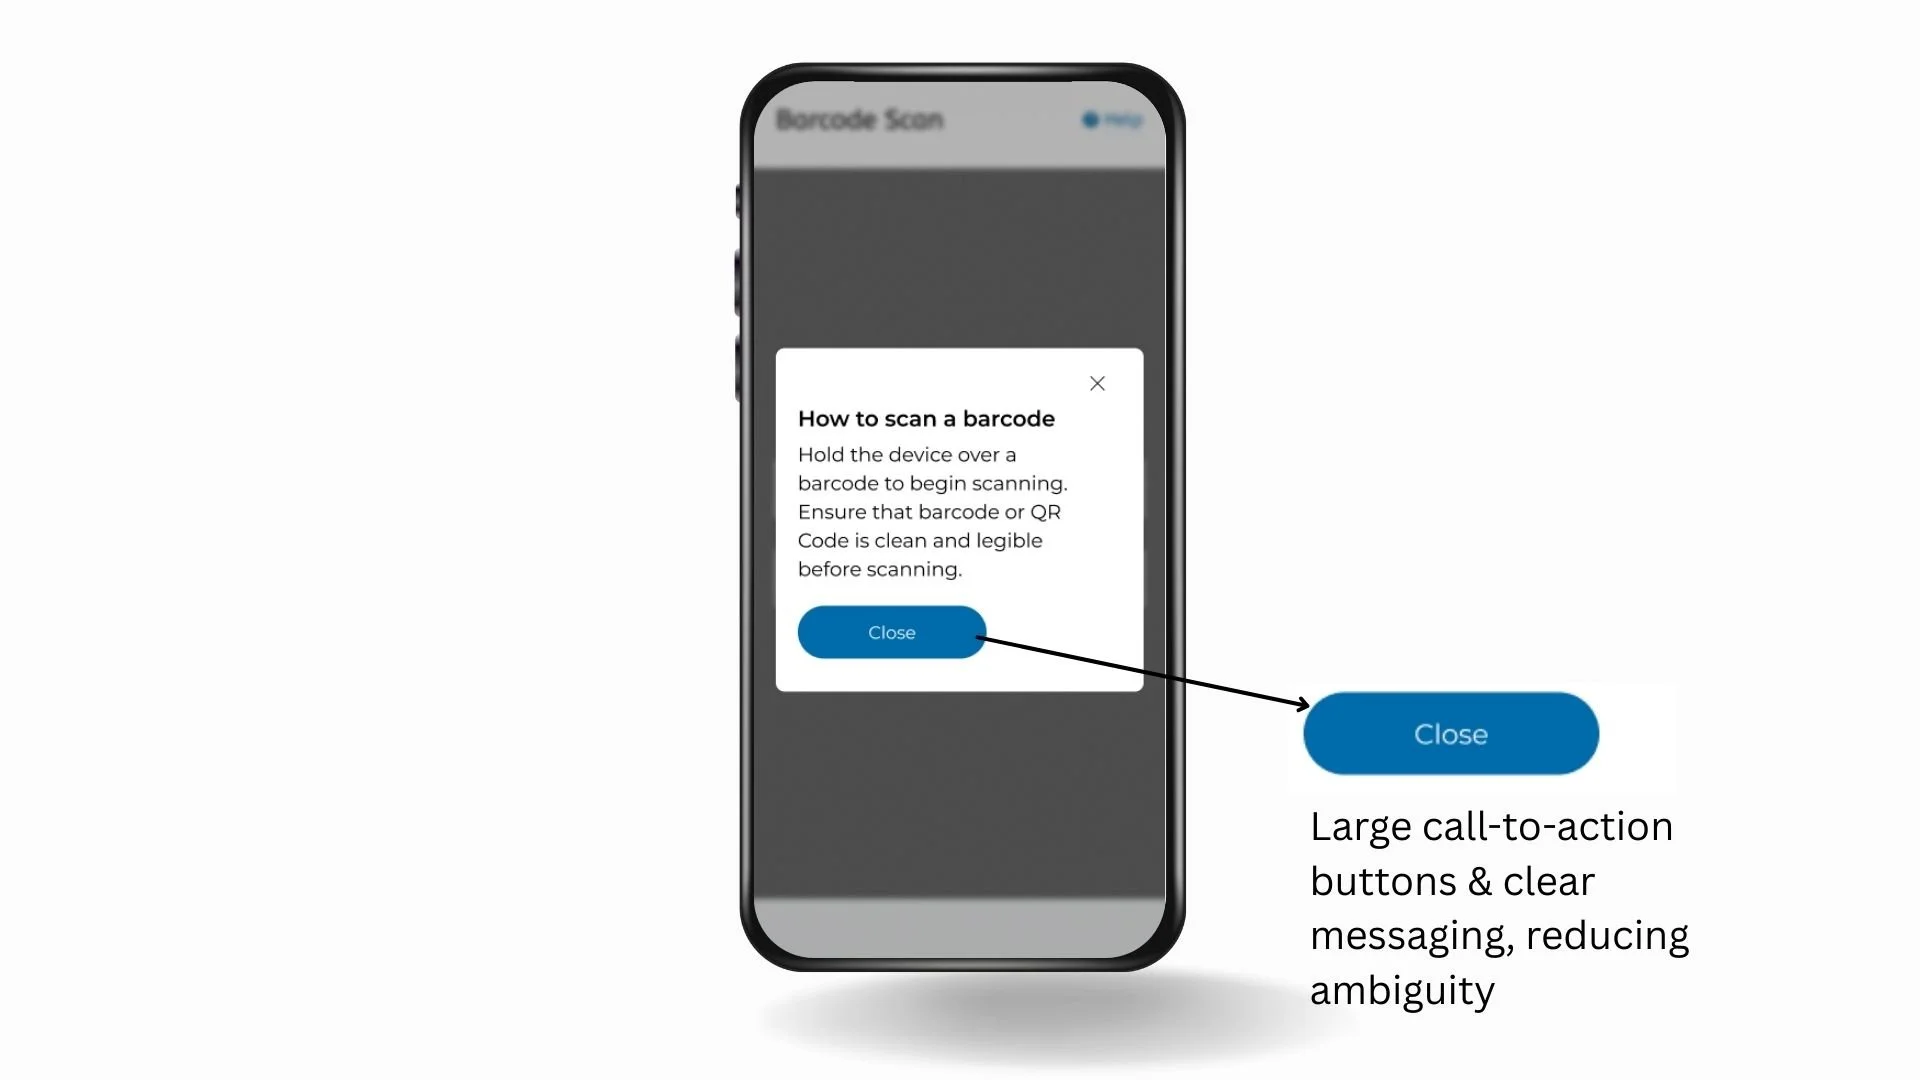
Icon and Labeling: Vague placeholders led to confusion; there is a need for intuitive symbols and text.
Accessibility: Early concepts like high-contrast were promising but needed more explicit features (e.g., voice sketches).
Flow Gaps: Linear designs missed back navigation; personalization lacked depth in sketches.
Feedback Synthesis
Iterations
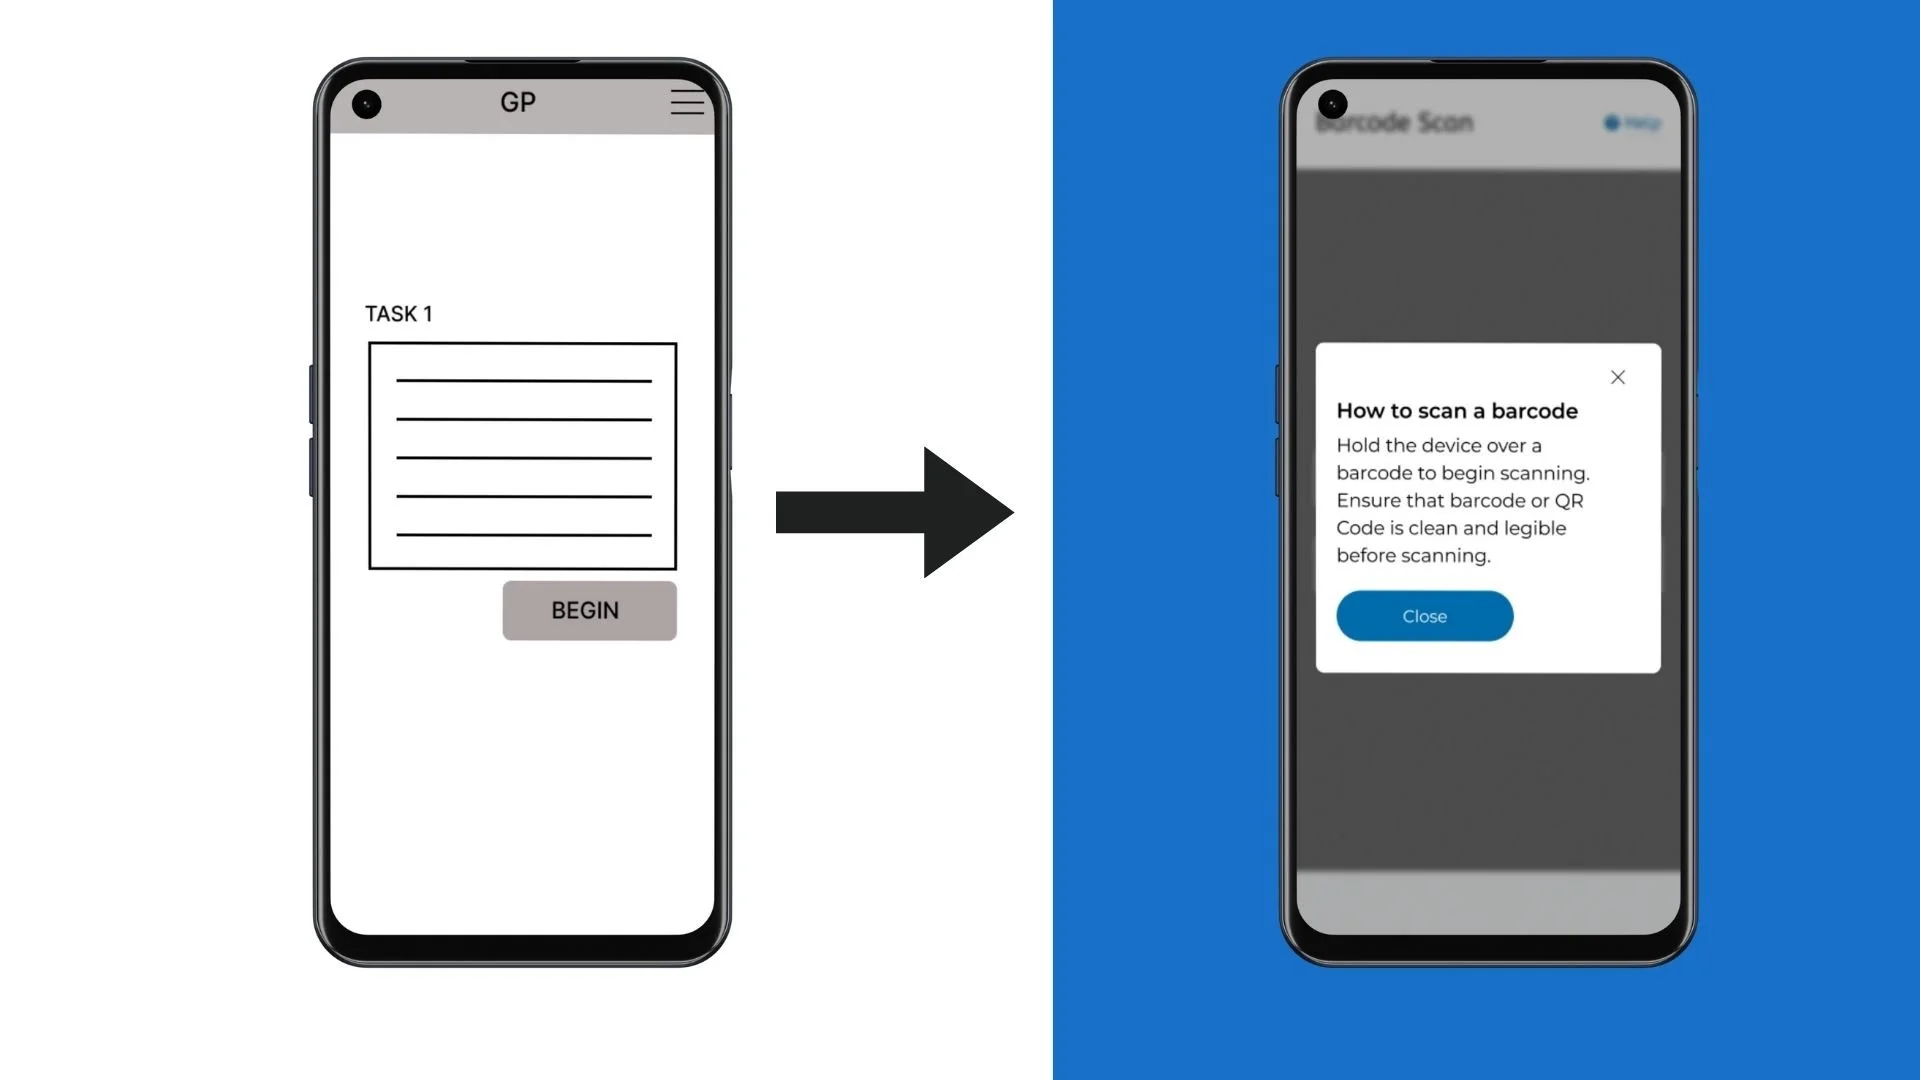
I started to develop the high fidelity prototype, Using insights drawn from participant feedback in the Usability Study
From Low to High fidelity
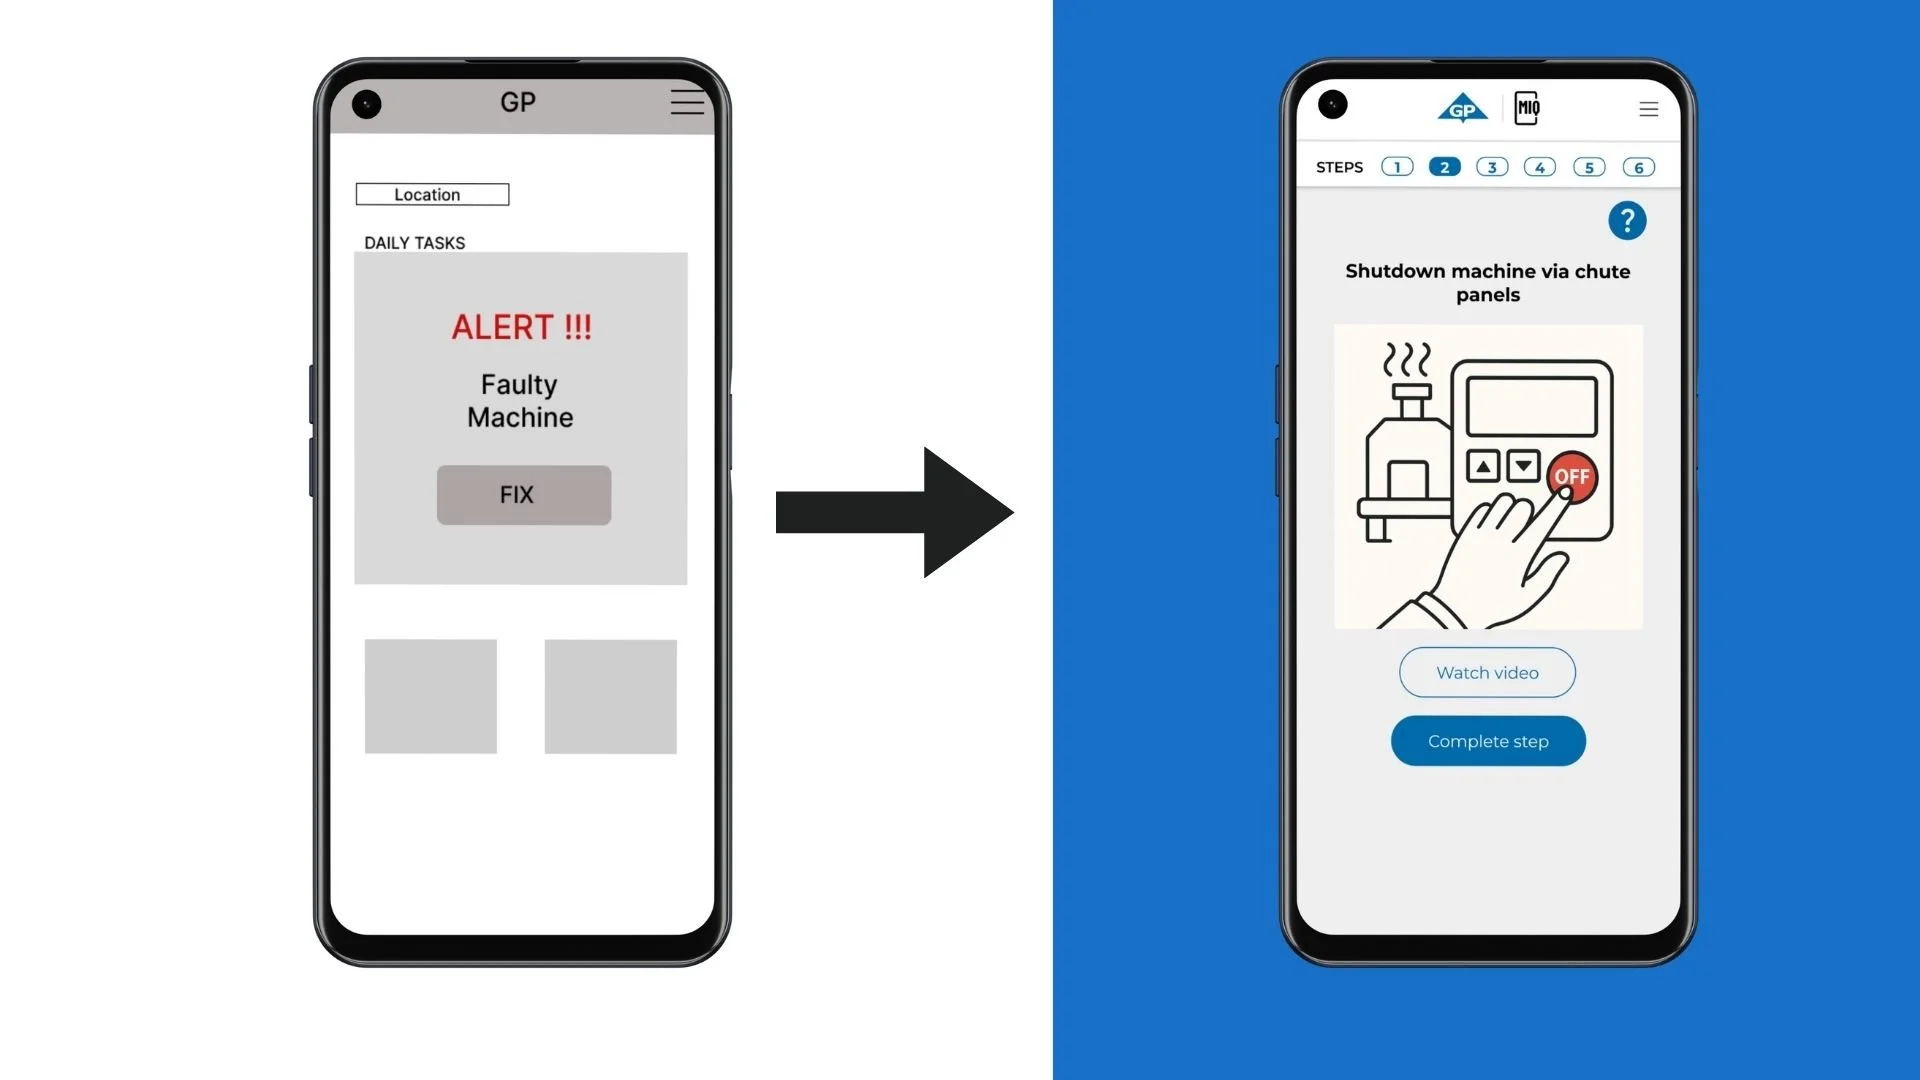
Going back to the problem and goal statement, it was important to show how we have incorporated the users most important requests into how mock ups.
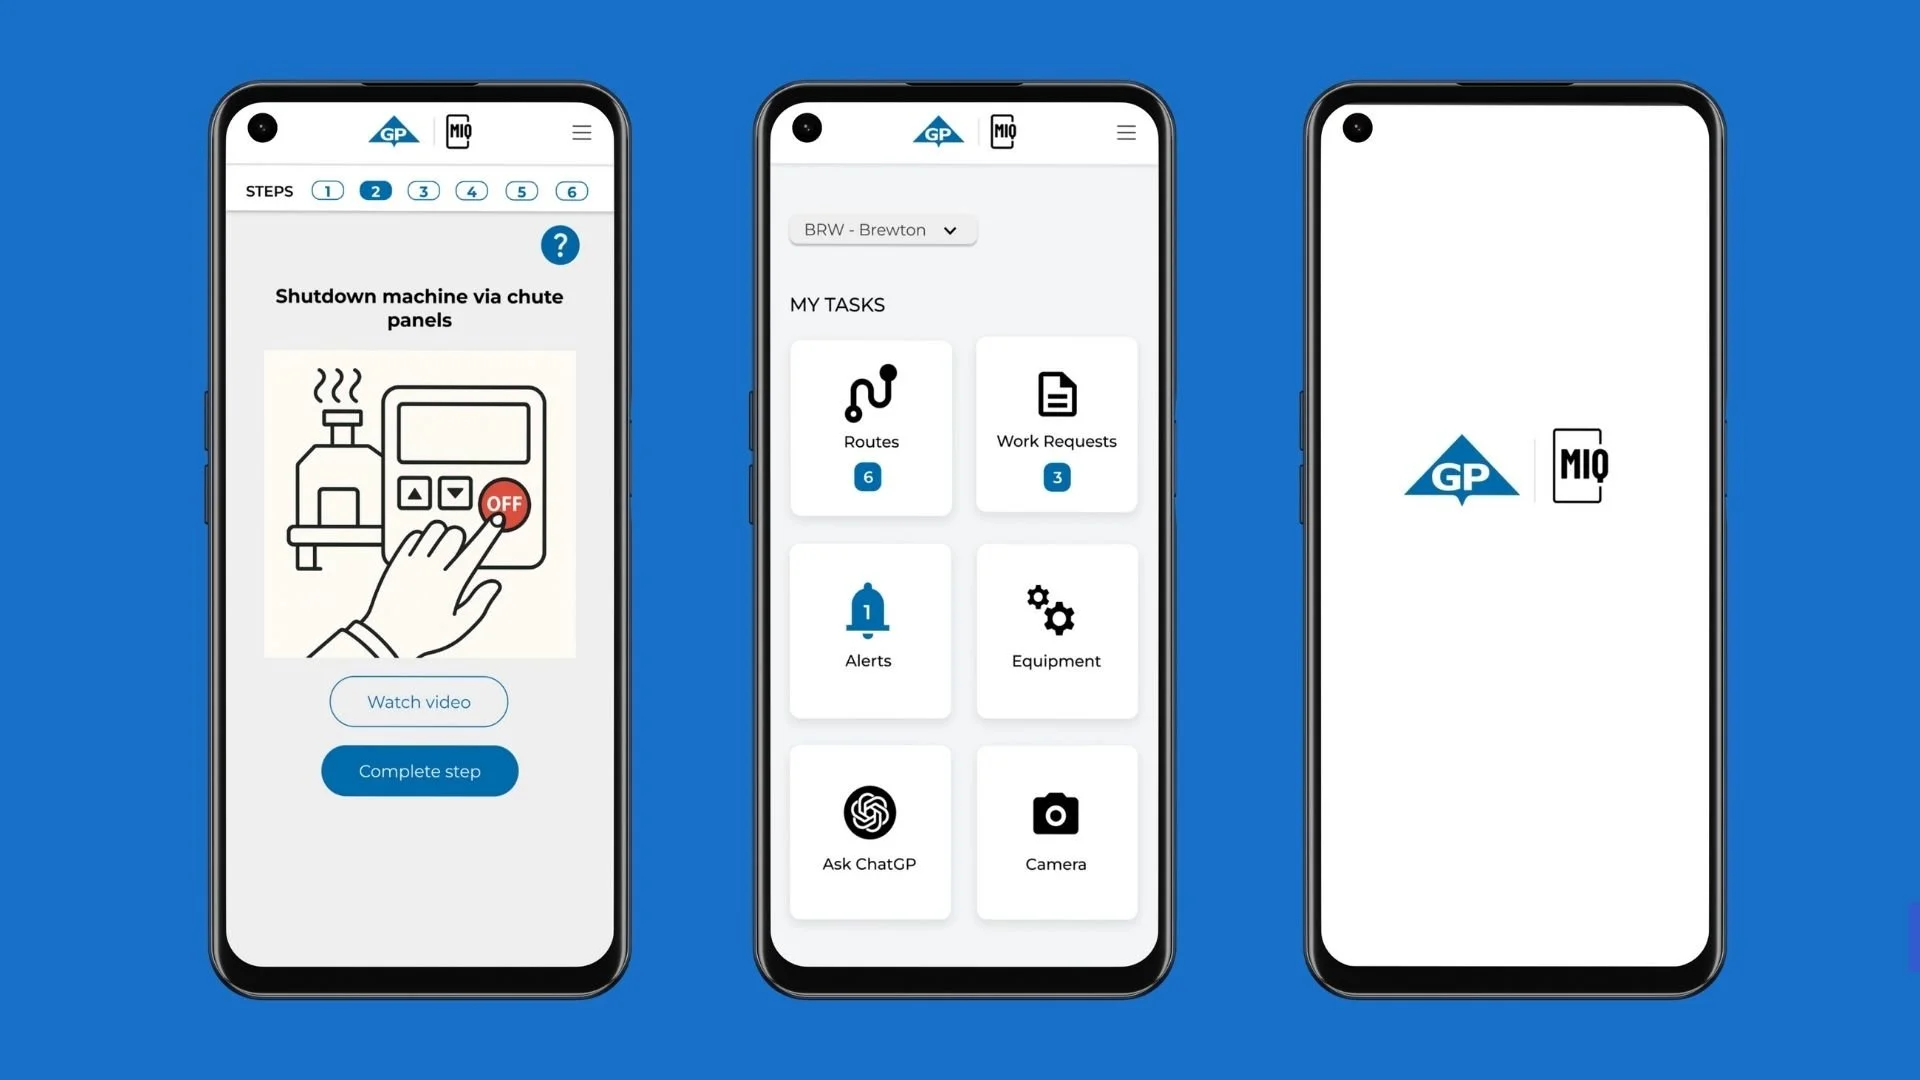
Dissecting the Essentials
The Footage below simulates a facility operator troubleshooting a machine following step by step guidance from MIQ
Task Completion
I returned the product to the potential users to test the high-fidelity prototype. The same methodology (Unmoderated testing) and test tasks were employed.
Usability Testing 2.0 Analysis
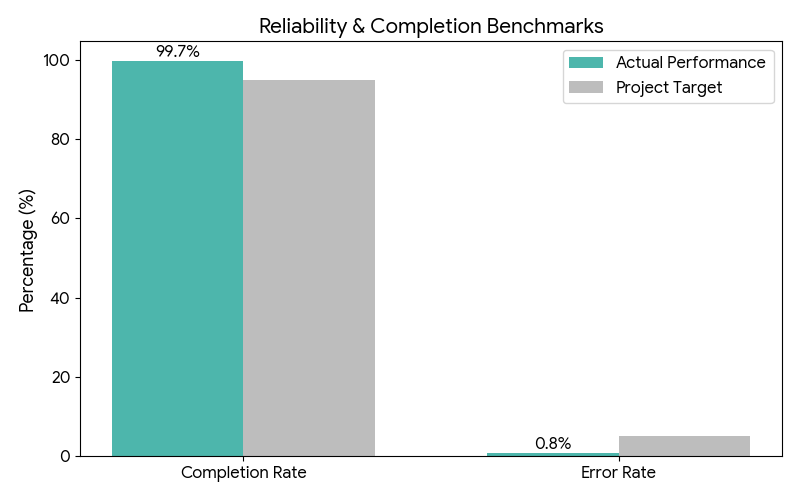
Performance Efficiency
The high-fidelity mobile ecosystem achieved nearly perfect task completion. By streamlining navigation, we realized a significant reduction in operational friction.
Completion Rate: 99.7% (Virtually eliminated drop-offs).
Time on Task: 3.6 minutes (35% faster than previous analog benchmark).
Error Rate: 0.8% (Negligible errors, mostly related to hardware connectivity rather than UI).
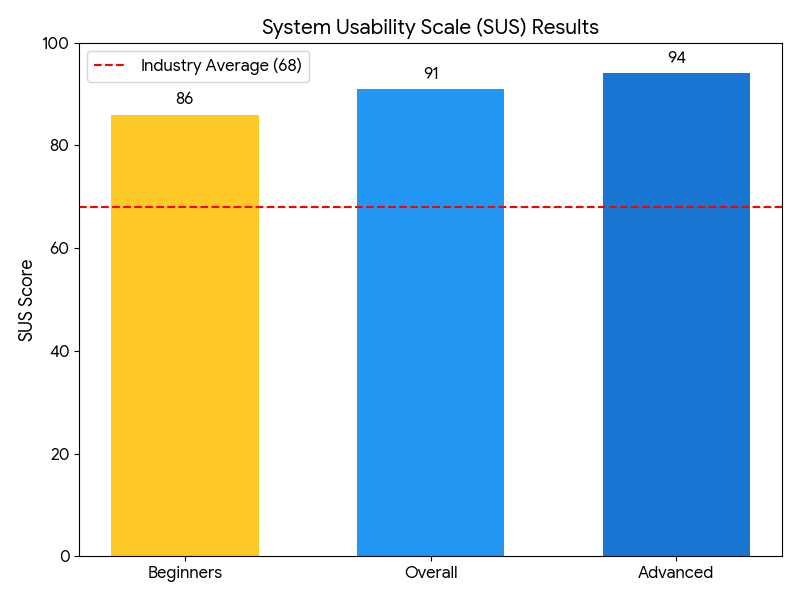
System Usability Scale (SUS)
The SUS is a standard industry metric for usability. A score above 68 is considered average; our result of 91 puts this system in the "Best Imaginable" category. Even our beginner persona cohort scored an 86, indicating the learning curve is exceptionally shallow.
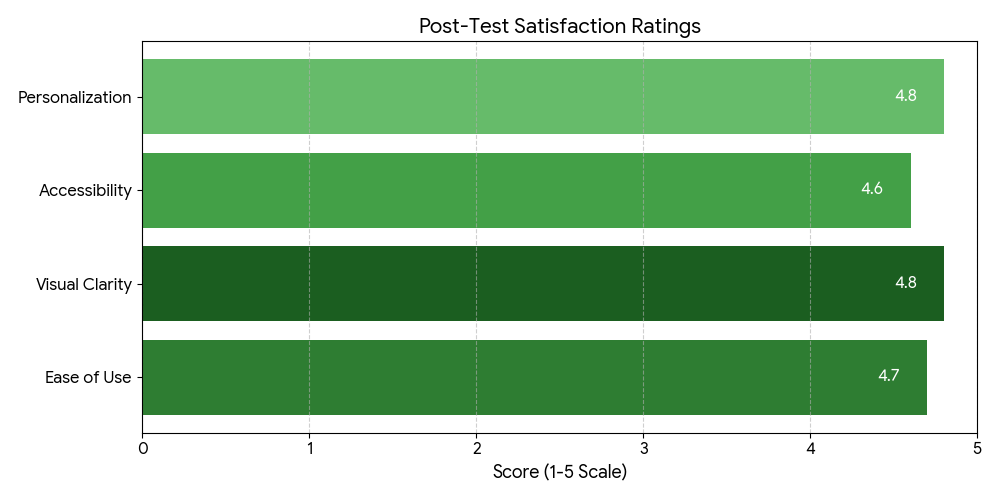
Post Launch Impact

Post-launch, the MIQ ecosystem delivered immediate business value by slashing task completion times by 30% and boosting data accuracy by 25%. By grounding the UI in the rugged realities of the mill floor, the project achieved a 40% ROI in just one quarter, proving that user-centered design is a strategic profit driver, not just an aesthetic choice. Below are the visuals to support the data:


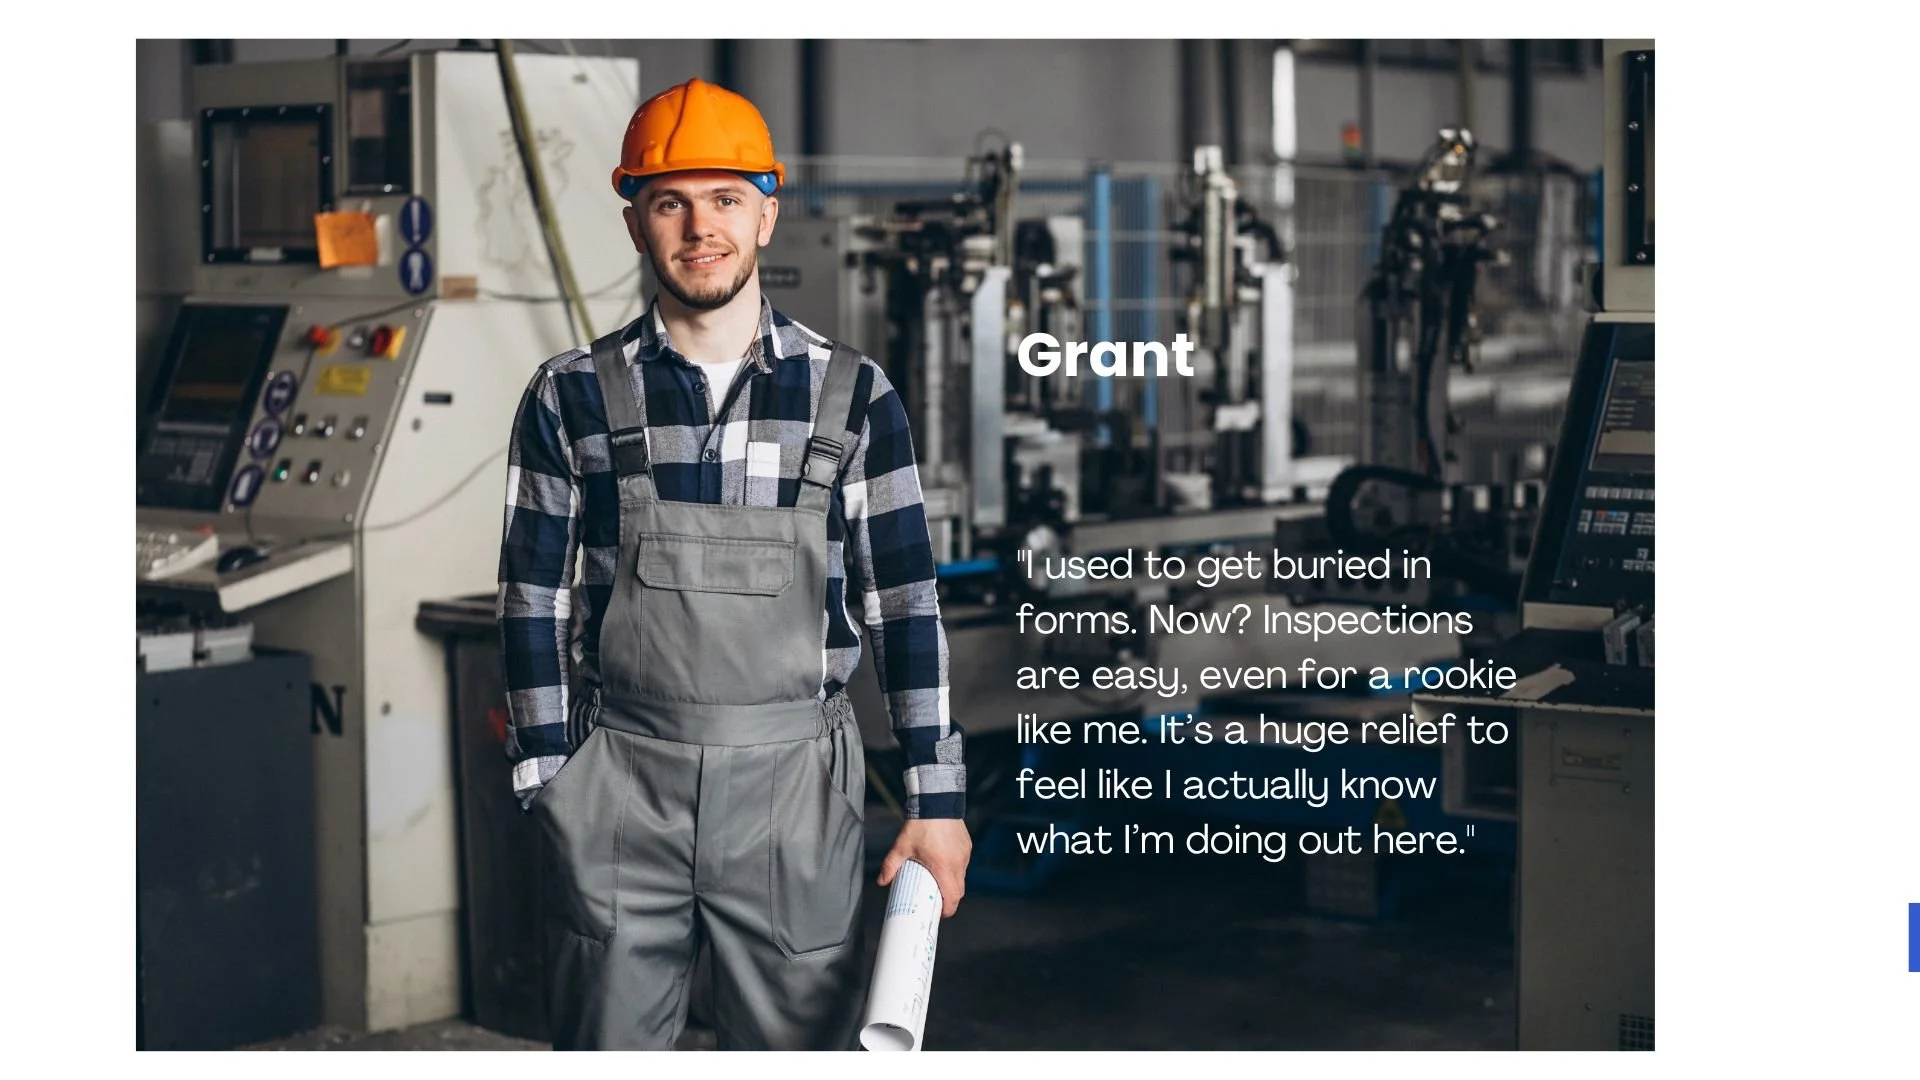
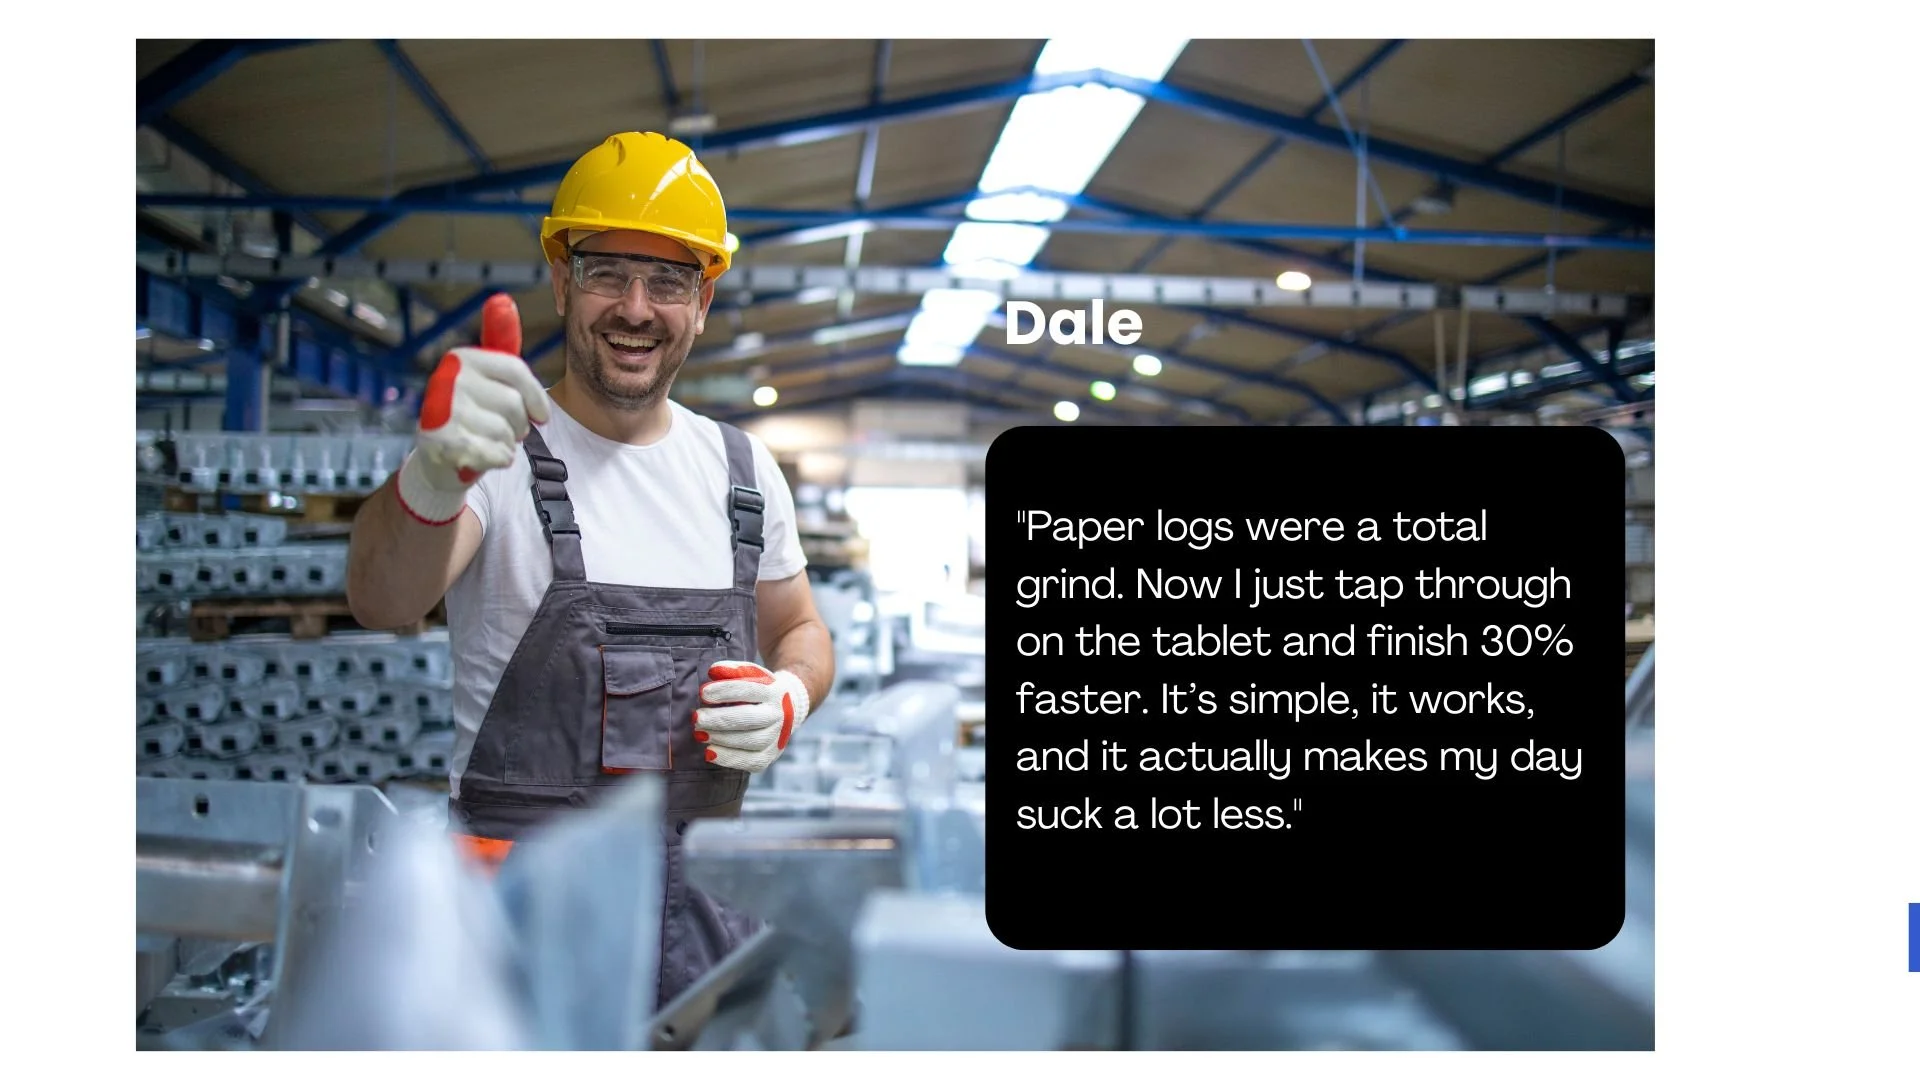
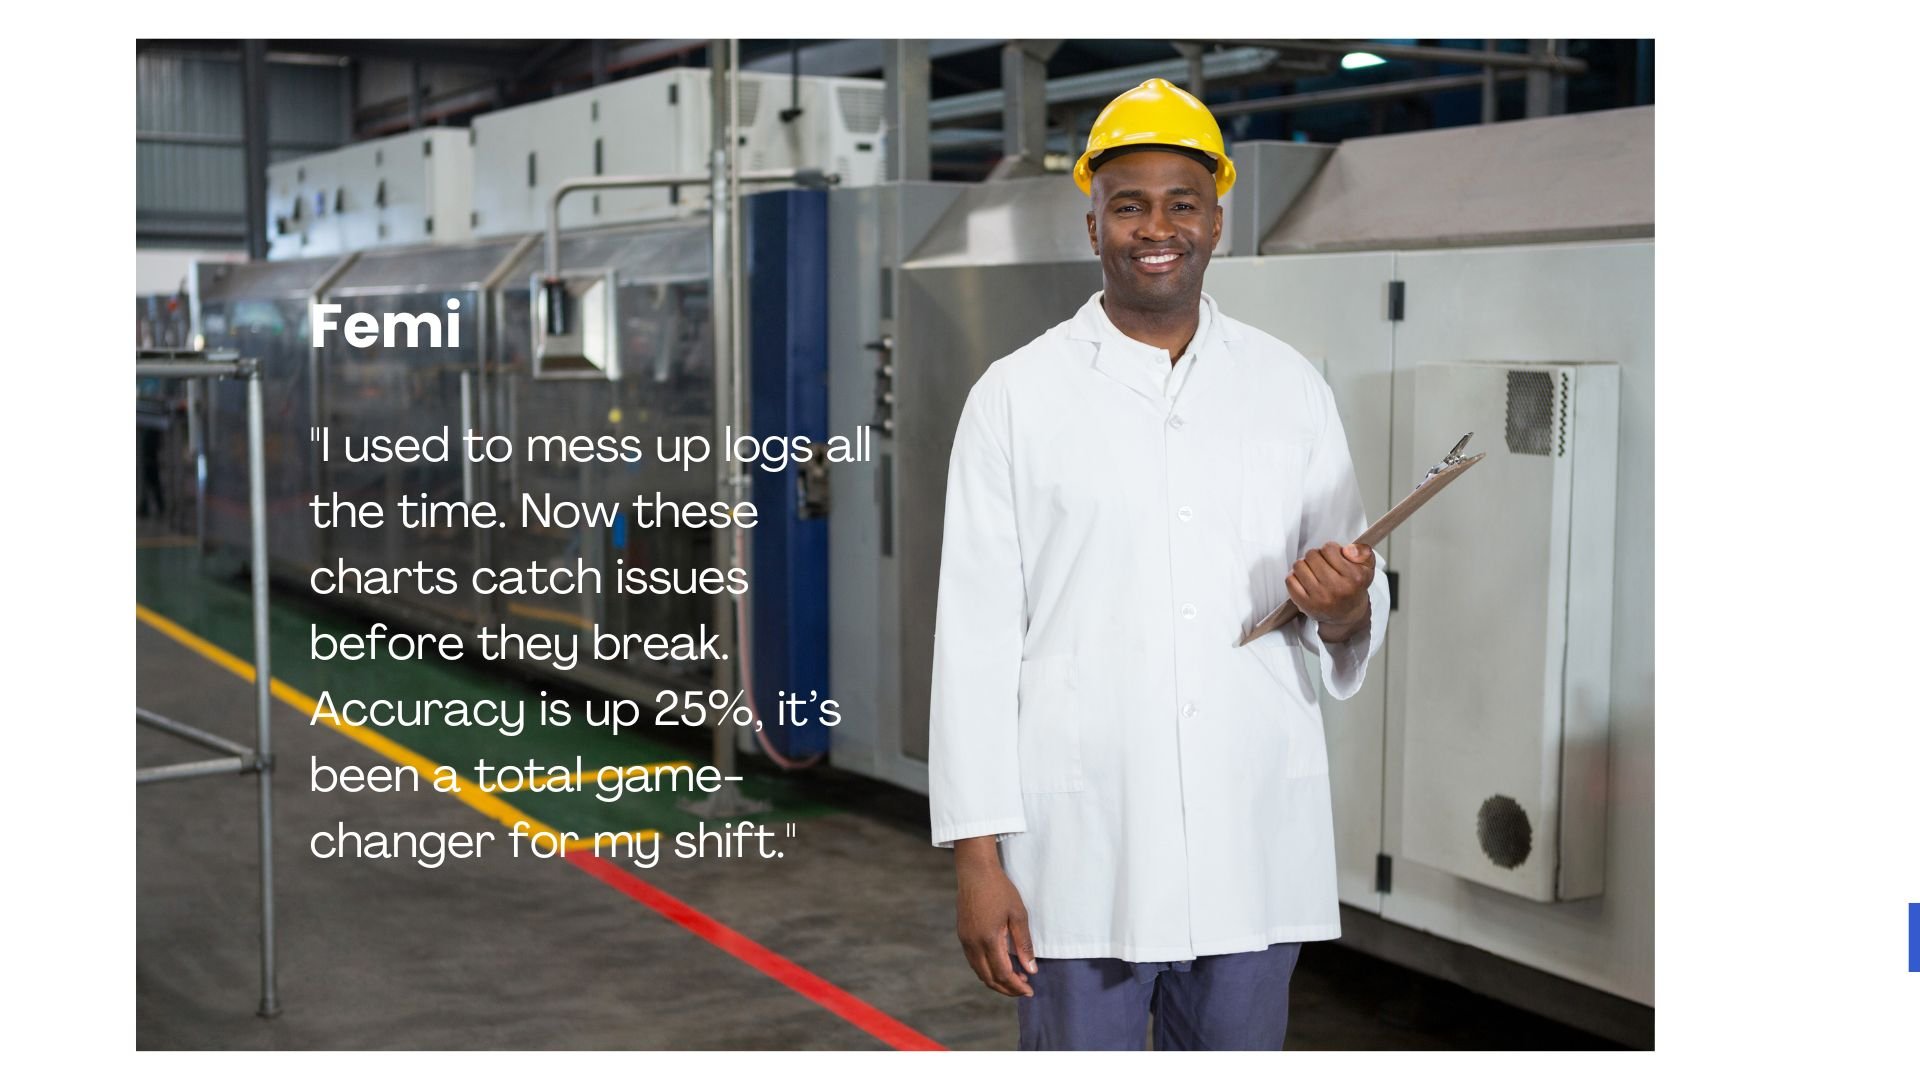
Voices of the Users
It was a thing of pride to here from the plant workers at Brewton about their experience with MIQ
Lesson learned

Empathy-Driven Design: This project reinforced the importance of empathy in creating informed designs. By visiting the plant and engaging directly with workers, I gained a deeper understanding of their pain points, enabling targeted solutions to their operational challenges.
Effective Communication and Collaboration: Working closely with team members, including product managers and engineers, enhanced my analytical skills and provided a clearer view of the project's broader impact on productivity and ROI.
The Critical Role of Feedback: Feedback is essential for success; without it, a project is doomed from the start. Witnessing the iterative improvements based on user input filled me with pride as a designer, validating the user-centered approach.